by Calculated Risk on 11/24/2010 03:28:00 PM
Wednesday, November 24, 2010
Comments on October Personal Income and Outlays Report
The BEA released the Personal Income and Outlays report for October this morning.
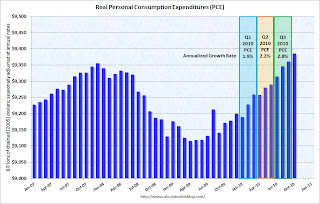
Personal income increased $57.6 billion, or 0.5 percent ... Personal consumption expenditures (PCE) increased $44.0 billion, or 0.4 percent.The following graph shows real Personal Consumption Expenditures (PCE) through October (2005 dollars). Note that the y-axis doesn't start at zero to better show the change.
...
Real PCE -- PCE adjusted to remove price changes -- increased 0.3 percent in October, compared with an increaseof 0.2 percent in September.
 Click on graph for large image.
The quarterly change in PCE is based on the change from the average in one quarter, compared to the average of the preceding quarter.
Even with no growth in November and December, PCE growth will be close to 2% in Q4, and it will probably be closer to 3% (annualized growth rate).
Also personal income less transfer payments increased sharply in October. This increased to $9,285.7 billion (SAAR, 2005 dollars) from $9,252.2 billion in September. This measure had stalled out over the summer.
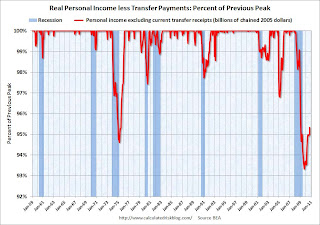 This graph shows real personal income less transfer payments as a percent of the previous peak. This has been slow to recover - and is still 4.7% below the previous peak - but is recovering again.
 Overall this was a fairly positive report, in line with consensus expectations, and suggests decent (but not robust) growth in October.
Europe Update: Irish Austerity, New Resolution Mechanism, Rising Yields
by Calculated Risk on 11/24/2010 12:43:00 PM
From the Irish Times: 'No group sheltered' as €15 billion savings plan unveiled
[S]pending on social welfare cut by €2.8 billion primarily through cuts in unemployment benefits and child income supports ... new levies on property and a hike in the basic rate of income tax ...And the WSJ reports obtaining a copy of Germany's proposal for a permanent resolution mechanism that would take effect after the EFSF expires in 2013. According to the WSJ, the proposal would create a
"permanent, intergovernmental crisis-management mechanism" in which euro-zone members, private investors and the International Monetary Fund would all play a role.This is the widely discussed "haircut" for bondholders.
Spanish 10-year bond yields have pushed above 5%, the Portugal 10-year yield is at 7%, and Ireland is up to 8.89%.
Note: Right now this is a European problem and I see little impact on the U.S. in the short term.
New Home Sales decline in October
by Calculated Risk on 11/24/2010 10:00:00 AM
The Census Bureau reports New Home Sales in October were at a seasonally adjusted annual rate (SAAR) of 283 thousand. This is down from 308 thousand in September.
 Click on graph for larger image in new window.
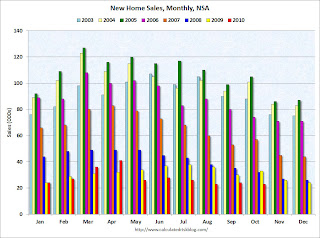
The first graph shows monthly new home sales (NSA - Not Seasonally Adjusted or annualized).
Note the Red columns for 2010. In October 2010, 23 thousand new homes were sold (NSA). This is a new record low for October.
The previous record low for the month of October was 29 thousand in 1981; the record high was 105 thousand in October 2005.
 The second graph shows New Home Sales vs. recessions for the last 47 years. The dashed line is the current sales rate.
Sales of new single-family houses in October 2010 were at a seasonally adjusted annual rate of 283,000, according to estimates released jointly today by the U.S. Census Bureau and the Department of Housing and Urban Development. This is 8.1 percent (±16.1%)* below the revised September rate of 308,000 and is 28.5 percent (±12.6%) below the October 2009 estimate of 396,000.And another long term graph - this one for New Home Months of Supply.
 Months of supply increased to 8.6 in October from 7.9 in September. The all time record was 12.4 months of supply in January 2009. This is still high (less than 6 months supply is normal).
The seasonally adjusted estimate of new houses for sale at the end of October was 202,000. This represents a supply of 8.6 months at the current sales rate.
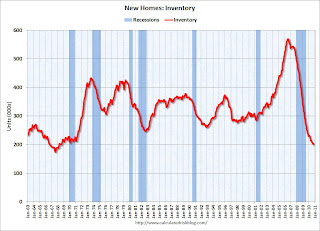 The final graph shows new home inventory.
 The 283 thousand annual sales rate for October is just above the all time record low in August (275 thousand). This was the weakest October on record and well below the consensus forecast of 314 thousand.
This was another very weak report.
Weekly Initial Unemployment Claims decrease sharply
by Calculated Risk on 11/24/2010 08:30:00 AM
The DOL reports on weekly unemployment insurance claims:
In the week ending Nov. 20, the advance figure for seasonally adjusted initial claims was 407,000, a decrease of 34,000 from the previous week's revised figure of 441,000. The 4-week moving average was 436,000, a decrease of 7,500 from the previous week's revised average of 443,500.
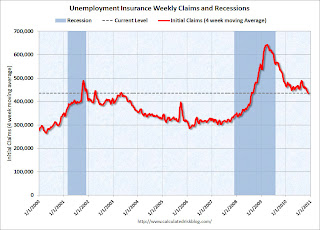 Click on graph for larger image in new window.
This graph shows the 4-week moving average of weekly claims since January 2000.
The dashed line on the graph is the current 4-week average. The four-week average of weekly unemployment claims decreased this week by 7,500 to 436,000.
This is the lowest level for the 4-week moving average since August 2008. This decline is good news.
MBA: Mortgage Purchase Applications Increase, highest level since May
by Calculated Risk on 11/24/2010 07:34:00 AM
The MBA reports: Mortgage Purchase Applications Increase in Latest MBA Weekly Survey
The Refinance Index decreased 1.0 percent from the previous week and is the lowest Refinance Index observed since the end of June. The seasonally adjusted Purchase Index increased 14.4 percent from one week earlier, which included Veterans Day. No adjustment was made for the holiday.
...
The average contract interest rate for 30-year fixed-rate mortgages increased to 4.50 percent from 4.46 percent, with points decreasing to 0.88 from 1.12 (including the origination fee) for 80 percent loan-to-value (LTV) ratio loans. This is the highest 30-year fixed rate observed in the survey since the week ending September 3, 2010.
 Click on graph for larger image in new window.
This graph shows the MBA Purchase Index and four week moving average since 1990.
Even with the increase in applications (seasonally adjusted), the four-week moving average of the purchase index is about 22% below the levels of April 2010.
Tuesday, November 23, 2010
Rewind: Irish Banks pass Stress Tests in July 2010
by Calculated Risk on 11/23/2010 11:56:00 PM
Earlier on existing home sales:
The Irish bank stress tests ...
The Central Bank and Financial Regulator CEBS July 2010 Stress Test Results
Allied Irish Banks plc
The exercise was conducted using the scenarios, methodology and key assumptions provided by CEBS. As a result of the assumed shock under the adverse scenario, the estimated consolidated Tier 1 capital ratio would change to 7.2% in 2011 compared to 7.0% as of end of 2009. An additional sovereign risk scenario would have a further impact of 0.70 of a percentage point on the estimated Tier 1 capital ratio, bringing it to 6.5% at the end of 2011, compared with the CRD regulatory minimum of 4%.And The Central Bank and Financial Regulator CEBS July 2010 Stress Test Results
The Governor and Company of the Bank of Ireland
As a result of the assumed shock under the adverse scenario, the estimated consolidated Tier 1 capital ratio would change to 7.6% in 2011 compared to 9.2% as of end of 2009. An additional sovereign risk scenario would have a further impact of 0.50 of a percentage point on the estimated Tier 1 capital ratio, bringing it to 7.1% at the end of 2011, compared with the CRD regulatory minimum of 4%.And today from the Irish Times: Dramatic fall in value of Irish bank stocks
Ooops ...
State Unemployment Rates in October: "Little changed" from September
by Calculated Risk on 11/23/2010 08:06:00 PM
Earlier on existing home sales:
 Click on graph for larger image in new window.
This graph shows the high and low unemployment rates for each state (and D.C.) since 1976. The red bar is the current unemployment rate (sorted by the current unemployment rate).
Eight states now have double digit unemployment rates. A number of other states are close.
From the BLS: Regional and State Employment and Unemployment Summary
Regional and state unemployment rates were little changed in October. Nineteen states and the District of Columbia recorded unemployment rate decreases, 14 states registered rate increases, and 17 states had no rate change, the U.S. Bureau of Labor Statistics reported today.
...
Nevada continued to register the highest unemployment rate among the states, 14.2 percent in October. The states with the next highest rates were Michigan, 12.8 percent, and California, 12.4 percent. North Dakota reported the lowest jobless rate, 3.8 percent, followed by South Dakota and Nebraska, at 4.5 and 4.7 percent, respectively.
...
In October, two states experienced statistically significant unemployment rate changes from September: Maine and Massachusetts (-0.3 percentage point each).
LPS: Over 4.3 million loans 90+ days or in foreclosure
by Calculated Risk on 11/23/2010 04:10:00 PM
LPS Applied Analytics released their October Mortgage Performance data today. According to LPS:
• The average number of days delinquent for loans in foreclosure is a record 492 days
• Over 4.3 million loans are 90 days or more delinquent or in foreclosure
• Foreclosure sales plummeted by 35% in October (as a result of the widespread moratoria)
• Nearly 20% of loans that have been delinquent more than two years are still not in foreclosure
 Click on graph for larger image in new window.
This graph provided by LPS Applied Analytics shows the percent delinquent, percent in foreclosure, and total non-current mortgages.
The percent in the foreclosure process is trending up because of the foreclosure moratoriums.
According to LPS, 9.29 percent of mortgages are delinquent, and another 3.92 are in the foreclosure process for a total of 13.20 percent. It breaks down as:
• 2.72 million loans less than 90 days delinquent.
• 2.24 million loans 90+ days delinquent.
• 2.09 million loans in foreclosure process.
For a total of 7.04 million loans delinquent or in foreclosure.
This is similar to the quarterly data from the Mortgage Bankers Association.
Note: I've seen some people include these 7+ million delinquent loans as "shadow inventory". This is not correct because 1) some of these loans will cure, and 2) some of these homes are already listed for sale (so they are included in the visible inventory).
FOMC Minutes: Forecasts revised down again, Disagreement on outlook
by Calculated Risk on 11/23/2010 02:00:00 PM
From the November 2-3, 2010 (and conference call held on October 15, 2010) FOMC meeting.
The Fed revised down their forecasts again:
| Economic projections of Federal Reserve Governors and Reserve Bank presidents | |||
|---|---|---|---|
| 2010 | 2011 | 2012 | |
| Change in Real GDP | 2.4 to 2.5% | 3.0 to 3.6% | 3.6 to 4.5% |
| June projections | 3.0% to 3.5% | 3.5% to 4.2% | 3.5% to 4.5% |
| April projections | 3.2% to 3.7% | 3.4% to 4.5% | 3.5% to 4.5% |
| Unemployment Rate | 9.5 to 9.7% | 8.9 to 9.1% | 7.7 to 8.2% |
| June projections | 9.2% to 9.5% | 8.3% to 8.7% | 7.1% to 7.5% |
| April projections | 9.1% to 9.5% | 8.1% to 8.5% | 6.6% to 7.5% |
| PCE Inflation | 1.2 to 1.4% | 1.1 to 1.7% | 1.1 to 1.8% |
| June projections | 1.0% to 1.1% | 1.1% to 1.6% | 1.0% to 1.7% |
| April projection | 1.2% to 1.5% | 1.1% to 1.9% | 1.2% to 2.0% |
There was apparently some significant disagreement:
Participants generally agreed that the most likely economic outcome would be a gradual pickup in growth with slow progress toward maximum employment. They also generally expected that inflation would remain, for some time, below levels the Committee considers most consistent, over the longer run, with maximum employment and price stability. However, participants held a range of views about the risks to that outlook. Most saw the risks to growth as broadly balanced, but many saw the risks as tilted to the downside. Similarly, a majority saw the risks to inflation as balanced; some, however, saw downside risks predominating while a couple saw inflation risks as tilted to the upside. Participants also differed in their assessments of the likely benefits and costs associated with a program of purchasing additional longer-term securities in an effort to provide additional monetary stimulus, though most saw the benefits as exceeding the costs in current circumstances.
Misc: Europe, FDIC Quarterly Report, Richmond Manufacturing Survey and more
by Calculated Risk on 11/23/2010 12:44:00 PM
Plenty of data today ...
“I don’t want to paint a dramatic picture, but I just want to say that a year ago we couldn’t imagine the debate we had in the spring and the measures we had to take” over Greece, Merkel said ... “We are facing an exceptionally serious situation as far as the euro’s situation is concerned.”Bond spreads for Spain hit a record today and the 10-year yield moved about 4.9%. The 10-year yields for Ireland and Portugal moved higher today too.
Net income for the 7,760 insured commercial banks and savings institutions reporting quarterly financial results totaled $14.5 billion, a considerable improvement over the $2 billion reported a year ago. Third quarter net income was below the $17.7 billion and $21.4 billion reported in the first and second quarters of this year, respectively, but the shortfall was attributable to a $10.1 billion quarterly net loss at one large institution that had a $10.4 billion charge for goodwill impairment. Absent this loss, third quarter earnings would have represented a three-year high. Almost two out of every three institutions (63.3 percent) reported higher net income than a year earlier, and fewer than one in five (18.9 percent) was unprofitable. This is the lowest percentage of unprofitable institutions since second quarter 2008. A year ago, more than 27 percent of all institutions reported negative net income.The number of problem institutions increased to 860 (about 11% of all institutions) with $379.2 billion in assets (about 2.8% of all assets are at official problem institutions).
In November, the seasonally adjusted composite index of manufacturing activity — our broadest measure of manufacturing — rose four points to 9 from October's reading of 5. Among the index's components, shipments rose four points to 7, new orders edged up two points to finish at 10, and the jobs index increased six points to 10.This is slightly better than expected. I'll post a graph when after all the regional surveys have been released.
And earlier on existing home sales:


