 RSS Feed
 by Calculated Risk on 10/04/2010 10:06:00 AM
Monday, October 04, 2010
Pending Home Sales increase 4.3% in August
From the NAR: Pending Home Sales Show Another Gain
The Pending Home Sales Index ... rose 4.3 percent to 82.3 based on contracts signed in August from a downwardly revised 78.9 in July, but is 20.1 percent below August 2009 when it was 103.0. The data reflects contracts and not closings, which normally occur with a lag time of one or two months.July was revised down from 79.4. Tom Lawler forecast an increase of about 4% - right on again.
This suggests some bounce back in existing home sales in September and October, but months-of-supply will probably still be in double digits - putting downward pressure on house prices.
Rates keep falling: 2-Year Treasury Yield Hits Record Low
by Calculated Risk on 10/04/2010 09:00:00 AM
Just a look at falling treasury yields and mortgage rates ...
From Reuters: US 2-Year Treasury Yield Hits Record Low
The two-year U.S. Treasury note yield fell to a record low of 0.403 percent on Monday ... the 30-year T-bond rose almost a full point in price to yield 3.676 percent, down 4 bps.The 10-year yield is down to 2.49% and, according to Freddie Mac (for the week ending Sept 30th): "The 30-year fixed-rate mortgage rate [4.32 percent] dropped to tie the survey’s all-time low and the 15-year fixed-rate [3.75 percent] set another record low." And mortgage rates have probably fallen further over the last week.
Lots of records ...
Sunday, October 03, 2010
Nightly Mortgage Mess
by Calculated Risk on 10/03/2010 11:32:00 PM
Note: Here is the weekly schedule for Oct 3rd, and the summary for last week.
A few articles ...
From Gretchen Morgenson at the NY Times: Flawed Paperwork Aggravates a Foreclosure Crisis
The implications are not yet clear for borrowers who have been evicted from their homes as a result of improper filings. But legal experts say that courts may impose sanctions on lenders or their representatives or may force banks to pay borrowers’ legal costs in these cases.Sanctions and awarding the defendants legal costs are likely - and it will be costly to fix these errors, but it is very unlikely in a foreclosure case that a judge will dismiss the bank's complaint with prejudice.
Judges may dismiss the foreclosures altogether, barring lenders from refiling and awarding the home to the borrower. That would create a loss for the lender or investor holding the note underlying the property. Almost certainly, lawyers say, lawsuits on behalf of borrowers will multiply.
The facts of these cases are 1) the borrower had a mortgage, and 2) the borrower is seriously delinquent (with the exception of a few cases with outright errors). Those facts are not in dispute. Just something to remember when reading these stories.
From Robbie Whelan at the WSJ: Foreclosure? Not So Fast
Israel Machado's foreclosure started out as a routine affair. In the summer of 2008, as the economy began to soften, Mr. Machado's pool-cleaning business suffered and like millions of other Americans, he fell behind on his $400,000 mortgage.That explains why Machado (and I suppose others) are hiring attorneys - they are trying to get the banks to do a principal reduction.
But Mr. Machado's response was unlike most other Americans'. Instead of handing his home over to the lender, IndyMac Bank FSB, he hired Ice Legal LP in nearby Royal Palm Beach to fight the foreclosure. ...
Mr. Machado and his lawyer, Tom Ice, say they now want to convince the owners of the mortgage to cut Mr. Machado's loan balance to between $150,000 and $200,000—the current selling price for comparable homes in his community near West Palm Beach. "The whole intent was to get them to come to the negotiating table, to get me in a fixed-rate mortgage that worked," Mr. Machado said.
And from the NY Times editorial: On the Foreclosure Front
It is hard to be shocked. During the bubble, banks and other lenders ignored loan standards and stuffed the mortgage pipeline with toxic loans and related securities. Since the bubble burst, efforts to rework bad loans have been slowed by the lenders’ resistance, and by their incompetence.
...
The robo-signing scandal is yet another reminder that it is folly to rely on banks that got us into this mess to get us out.
A QE1 Timeline
by Calculated Risk on 10/03/2010 05:21:00 PM
Note: Here is the weekly schedule for Oct 3rd, and the summary for last week.
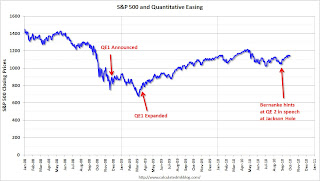
QE2 will probably arrive on November 3rd. By request here is a look back at the QE1 announcements (phased in over a few months):
S&P 500: 851.81
The Federal Reserve announced
the purchase of the direct obligations of housing-related government-sponsored enterprises (GSEs)--Fannie Mae, Freddie Mac, and the Federal Home Loan Banks--and mortgage-backed securities (MBS) backed by Fannie Mae, Freddie Mac, and Ginnie Mae.
...
Purchases of up to $100 billion in GSE direct obligations under the program will be conducted with the Federal Reserve's primary dealers through a series of competitive auctions and will begin next week. Purchases of up to $500 billion in MBS will be conducted by asset managers selected via a competitive process with a goal of beginning these purchases before year-end. Purchases of both direct obligations and MBS are expected to take place over several quarters.
S&P 500: 913.18
As previously announced, over the next few quarters the Federal Reserve will purchase large quantities of agency debt and mortgage-backed securities to provide support to the mortgage and housing markets, and it stands ready to expand its purchases of agency debt and mortgage-backed securities as conditions warrant. The Committee is also evaluating the potential benefits of purchasing longer-term Treasury securities.
S&P 500: 874.09
The Federal Reserve continues to purchase large quantities of agency debt and mortgage-backed securities to provide support to the mortgage and housing markets, and it stands ready to expand the quantity of such purchases and the duration of the purchase program as conditions warrant. The Committee also is prepared to purchase longer-term Treasury securities if evolving circumstances indicate that such transactions would be particularly effective in improving conditions in private credit markets.
S&P 500: 794.35
To provide greater support to mortgage lending and housing markets, the Committee decided today to increase the size of the Federal Reserve’s balance sheet further by purchasing up to an additional $750 billion of agency mortgage-backed securities, bringing its total purchases of these securities to up to $1.25 trillion this year, and to increase its purchases of agency debt this year by up to $100 billion to a total of up to $200 billion. Moreover, to help improve conditions in private credit markets, the Committee decided to purchase up to $300 billion of longer-term Treasury securities over the next six months.
 Click on graph for larger image in new window.
S&P 500: 1064.79
This is not investment advice!
Weekly Schedule for October 3rd
by Calculated Risk on 10/03/2010 12:40:00 PM
The previous post is the Summary for Week ending Oct 2nd
The key economic release this week is the September employment report on Friday. Fed Chairman Ben Bernanke will speak Monday evening, and his speech will be closely watched for additional hints on QE2.
Expected on Monday: September Personal Bankruptcy Filings
During the week: Reis is expected to release their Q3 Office, Mall and Apartment vacancy rate reports.
10:00 AM ET: Manufacturers' Shipments, Inventories and Orders for August. The consensus is for a 0.3% decline in August.
10:00 AM: Pending Home Sales Index for August. The consensus is for a slight increase (about 2.8%) in contracts signed. Economist Tom Lawler noted "My “best guess” right now on the pending home sales index is that it will show a seasonally adjusted increase from July to August of around 4%." It usually takes 45 to 60 days to close, so this will provide an early indication of closings in October.
11:30 AM: NY Fed's Brian Sack to speak at CFA conference in California: "Managing the Federal Reserve’s Balance Sheet".
7:30 PM: Fed Chairman Ben Bernanke will speak at the Rhode Island Public Expenditure Council meeting in Rhode Island. Although this is a "fiscal sustainability" meeting, Bernanke has promised not to speak on fiscal issues.
“With Rhode Island remaining among the top five states for unemployment, and with increasing signs that the national recovery is slowing, Ben S. Bernanke, Chairman of the Federal Reserve will visit Rhode Island to deliver the keynote address at the RIPEC Annual Dinner.”
10:00 AM: ISM Non-manufacturing Index for September. The consensus is for an increase in the service index to 52.0 from 51.5 in August.
7:00 AM: The Mortgage Bankers Association (MBA) will release the mortgage purchase applications index. This index declined sharply following the expiration of the tax credit, and the index has only recovered slightly over the last couple months - suggesting reported home sales through at least October will be very weak.
8:15 AM: ADP Employment Report for September. This report is for private payrolls only (no government). The consensus is for +23,000 payroll jobs in September - still weak, but an improvement over the 10,000 jobs reported lost in August.
8:30 AM: The initial weekly unemployment claims report will be released. Consensus is for a decline to 450,000 from 453,000 last week.
10:00 AM: Job Openings and Labor Turnover Survey for August from the BLS. This report has been showing very little turnover in the labor market and few job openings.
Fed Speeches: Dallas Fed President Richard Fisher will speak at the Economic Club of Minnesota, and Kansas City Fed President Thomas Hoenig will speak at an economic forum in Omaha (Fisher and Hoenig oppose additional easing).
3:00 PM: Consumer Credit for August. The consensus is for another $4 billion decline in consumer credit.
8:30 AM: Employment Report for September. The consensus is for no change in payroll jobs, with 78,000 fewer Census jobs, or about +78,000 ex-Census increase in payrolls. The consensus is for the unemployment rate to increase slightly to 9.7% from 9.6% in August. For a short preview, see: September Employment Report Preview. This is the last employment report before the two day Fed meeting on Nov 2nd and 3rd.
10:00 AM: Monthly Wholesale Trade: Sales and Inventories for August. The consensus is 0.5% increase in inventories.
After 4:00 PM: The FDIC might have another busy Friday afternoon ...
Summary for Week ending Oct 2nd
by Calculated Risk on 10/03/2010 09:34:00 AM
Here is a summary of last week - mostly in graphs.
During the previous week, a number of Fed Presidents spoke about further easing (what is known as QE2: quantitative easing, round two). The majority seemed to favor taking additional action - probably purchasing longer term Treasury securities. Barring an upside surprise in the economic data, most analysts expect QE2 to arrive at 2:15 PM ET on November 3rd (when the next FOMC statement is released).
Another story was the "robo-signer" foreclosure mess that has led to GMAC, JPMorgan and BofA halting or reviewing foreclosure filings - and for some insurance companies to stop offering title insurance on related foreclosures.
There are links to other stories at the bottom of this post.
Based on an estimate from Autodata Corp, light vehicle sales were at a 11.76 million SAAR in Setpember. That is up 25.8% from September 2009 (the dip following cash-for-clunkers), and up 2.8% from the August 2010 sales rate.
 Click on graph for larger image in new window.
This graph shows the historical light vehicle sales (seasonally adjusted annual rate) from the BEA (blue) and an estimate for August (red, light vehicle sales of 11.76 million SAAR from Autodata Corp).
This is the high for the year - slightly higher than in March.
 The second graph shows light vehicle sales since the BEA started keeping data in 1967.
Note: dashed line is current month sales rate. The current sales rate is about at the bottom of the '90/'91 recession - when there were fewer registered drivers and a smaller population.
This was above most forecasts of around 11.6 million SAAR.
From S&P: Home Prices Remain Stable Around Recent Lows According to the S&P/Case-Shiller Home Price Indices
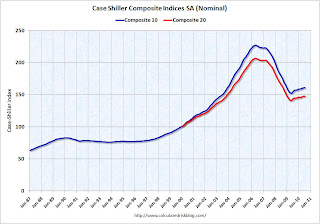 This graph shows the nominal seasonally adjusted Composite 10 and Composite 20 indices (the Composite 20 was started in January 2000).
The Composite 10 index is off 29.0% from the peak, and flat in July (SA).
The Composite 20 index is off 28.6% from the peak, and down 0.1% in July (SA).
The next graph shows the price declines from the peak for each city included in S&P/Case-Shiller indices.
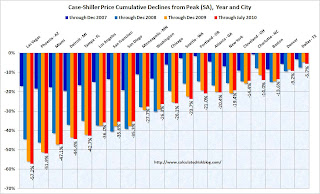 Prices increased (SA) in only 4 of the 20 Case-Shiller cities in July seasonally adjusted.
Prices in Las Vegas are off 57.2% from the peak, and prices in Dallas only off 5.7% from the peak.
Prices probably declined just about everywhere in July, but this will not be evident in the Case-Shiller index until next month since the Case-Shiller index is an average of three months.
From the BEA: Personal Income and Outlays, August 2010
Personal income increased $59.3 billion, or 0.5 percent ... Personal consumption expenditures (PCE) increased $41.3 billion, or 0.4 percent.
...
Real PCE increased 0.2 percent, the same increase as in July.
...
Personal saving as a percentage of disposable personal income was
5.8 percent in August, compared with 5.7 percent in July.
 This graph shows monthly real PCE since Q4 2009. the dashed red lines are the quarterly PCE (note: left scale doesn't start at zero to show the change).
The key in this report is that real PCE growth in Q3 will probably be around 2.0% annualized - barring a significant change in September. This suggests sluggish, but positive GDP growth in Q3.
PMI at 54.4% in September down from 56.3% in August.
From the Institute for Supply Management: September 2010 Manufacturing ISM Report On Business®
 Here is a long term graph of the ISM manufacturing index.
In addition to the decrease in the PMI, the ISM's new orders index fell to 51.1 from 53.1 in August, and the production index declined to 56.5 from 59.9.
The employment index declined to 56.5 from 60.4 in August.
And the inventory index was up for the 3rd month in a row to 55.6 from 51.4.
With new order growth slowing, and inventory increasing - further declines in the ISM PMI are very likely. As ISM's Norbert Ore noted, these indexes are "sending strong negative signals of weakening performance in the [manufacturing] sector".
The Census Bureau reported overall construction spending increased slightly in August.
 This graph shows private residential and nonresidential construction spending since 1993. Note: nominal dollars, not inflation adjusted.
Both residential and non-residential private construction spending declined in August. Residential spending is 64.7% below the peak early 2006, and 4.7% above the recent low in 2009.
Non-residential spending is 37.3% from the peak in January 2008.
Residential spending has turned slightly negative after the tax credit expired - and this indicates residential investment (RI) will be a drag on Q3 GDP.
Best wishes to all.
Saturday, October 02, 2010
Commercial Real Estate: End of Extend and Pretend?
by Calculated Risk on 10/02/2010 09:21:00 PM
Buck Wargo at the Las Vegas Sun reports that "extend and pretend" for commercial real estate (CRE) might be ending: Lenders gaining speed in going after commercial foreclosures
[The] tsunami of commercial foreclosures ... never materialized as ... lenders were working with owners to lower interest rates and extend loans ... Now that philosophy is starting to change.Las Vegas is in worse shape than most other areas, but it sounds like the lenders are now moving ahead and foreclosing on CRE properties - and that might mean the pace of CRE foreclosures will pick up nationwide.
"[A] number of banks have been hesitant to pull the trigger on foreclosures, but we have seen recently banks are beginning to go ahead with the foreclosure process.” [said John Delikanakis, an attorney with Snell & Wilmer]
...
“Banks are beginning to realize where they are at in that loan,” [Rob Moore of Faris Lee Investments] said. “They were postponing it waiting for things to get back where they can get out of the hold, but that’s not going to happen.”
...
"The time for ‘extending and pretending’ by the banks for a variety of commercial real estate loans has ended,” [John Restrepo, principal at Restrepo Consulting Group] said. “There finally is a realization by the banks, regulators and borrowers that the market will not recover sufficiently to save many commercial projects from foreclosure.”
Report: Title Insurance company stops insuring Chase Foreclosures
by Calculated Risk on 10/02/2010 05:04:00 PM
From David Streitfeld at the NY Times: Company Stops Insuring Titles in Chase Foreclosures
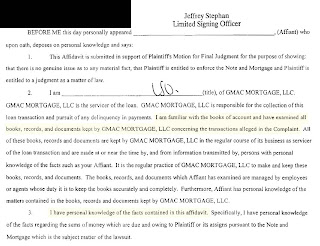
The company, Old Republic National Title Insurance, told its agents Friday that it would not write policies on foreclosed Chase properties until “the objectionable issues have been resolved,” according to a memorandum sent out by the firm’s underwriting department.For those who haven't seen it, here is an excerpt from an affidavit signed by Jeffrey Stephen of GMAC:
 Click on image for larger image in new window.
I've highlighted a couple of sentences in yellow. Source: Stopa Law Blog
According to the affidavit the affiant claims to have "examined" the details of the transactions in the complaint, and that he has "personal knowledge of the facts contained in the affidavit". In a disposition - according to media reports - the affiant admitted to just signing the documents without verifying the details. If so, the affidavit is not correct.
The affidavits are being withdrawn.
Obviously the title insurance companies are concerned about what will happen to homes that have already been through foreclosure - with false affidavits filed during the process - and that have already been sold to another party. I'll have more on this later ...
Unofficial Problem Bank List increases to 877 institutions
by Calculated Risk on 10/02/2010 01:27:00 PM
Note: this is an unofficial list of Problem Banks compiled only from public sources.
Here is the unofficial problem bank list for Oct 1, 2010.
Changes and comments from surferdude808:
The number of institutions on the Unofficial Problem Bank List rose this week but assets fell with the removal of a large publicly traded bank.
Removals include the failed Shoreline Bank ($104 million), an affiliate of the failed Chicago-based ShoreBank; and Sterling Savings Bank ($9.1 billion Ticker: STSA), which said in an 8-K that its enforcement action had been terminated.
There were six additions this week including First Savings Bank Northwest, Renton, WA ($1.3 billion Ticker: FFNW); Brooklyn Federal Savings Bank, Brooklyn, NY ($523 million Ticker: BFSB); Diamond Bank, FSB, Schaumburg, IL ($278 million); The Bank of Asheville, Asheville, NC ($214 million Ticker: WFSC); Alaska Pacific Bank, Juneau, AK ($177 million Ticker: AKPB), which is the first Alaska-based institution to make an appearance on the Unofficial Problem Bank List; and Wawel Savings Bank, Wallington, NJ ($96 million Ticker: WAWL).
After these changes, the Unofficial Problem Bank List includes 877 institutions with assets of $416.1 billion compared to 872 institutions with assets of $422.4 billion last week.
Transition Matrix
With the passage of another quarter, it is time to update the transition matrix. The Unofficial Problem Bank List debuted on August 7, 2009 with 389 institutions with assets of $276.3 billion (see table).
Over the past 13 months, 144 institutions have been removed from the original list with 103 due to failure, 29 due to action termination, and 12 due to unassisted merger. Thus, about 72 percent of the removals are from failure.
Nearly 27 percent of the 389 institutions on the original list have failed, which is substantially higher than the 12 percent figure usually cited by the media as the failure rate for institutions on the FDIC Problem Bank List. Failed bank assets have totaled $159 billion or nearly 58 percent of the $276.3 billion on the original list.
Since the publication of the original list, another 740 institutions have been added. However, only 632 of those 740 additions remain on the current list as 108 institutions have been removed in the interim. Of the 108 interim removals, 88 were due to failure, 15 were due to unassisted merger, 4 from action termination, and one from voluntary liquidation.
Again, failure represents a disproportionate 81.5 percent of the reason for removal. In total, 1,129 institutions have made an appearance on the Unofficial Problem Bank List and 191 or 16.9 percent have failed.
The average asset size of removals because of failure is $1.2 billion. Currently, the average asset size of institutions on the current list is $474 million versus $710 million on the original list. This would suggest the asset size of future failures will likely be lower.
| Unofficial Problem Bank List | |||
|---|---|---|---|
| Change Summary | |||
| Number of Institutions | Assets ($Thousands) | ||
| Start (8/7/2009) | 389 | 276,313,429 | |
| Subtractions | |||
| Action Terminated | 29 | (4,038,439) | |
| Unassisted Merger | 12 | (1,762,072) | |
| Failures | 103 | (159,037,514) | |
| Asset Change | (11,891,765) | ||
| Still on List at 7/02/2010 | 245 | 99,583,639 | |
| Additions | 632 | 316,517,379 | |
| End (10/01/2010) | 877 | 416,101,018 | |
| Interperiod Deletions1 | |||
| Action Terminated | 4 | 12,881,783 | |
| Unassisted Merger | 15 | 2,545,683 | |
| Voluntary Liquidation | 1 | 119,082 | |
| Failures | 88 | 70,091,963 | |
| Total | 108 | 85,638,511 | |
| 1Institution not on 8/7/2009 or 10/01/2010 list but appeared on a list between these dates. | |||
September Employment Report Preview
by Calculated Risk on 10/02/2010 08:50:00 AM
1) The consensus is for a headline payroll number of zero (no net payroll jobs added or lost) and for the unemployment rate to increase to 9.7% in September from 9.6% in August.
Goldman Sachs is forecasting a minus 50,000 headline payroll number and an increase in the unemployment rate to 9.7%.
2) My estimate is the decennial Census workforce was reduced by 78,000 in August. This suggests a consensus headline payroll number of +78,000 ex-Census.
 Click on graph for larger image in new window.
This graph shows the number of Census workers paid each week. The red labels are the weeks of the BLS payroll survey.
The Census payroll decreased from 83,955 for the week ending August 14th to 6,038 for the week ending September 18th.
So my estimate for the impact of the Census on September payroll employment is minus 78 thousand (this will probably be close).
With temporary payroll employment down to 6,038, September will be the last month with a significant decennial Census adjustment.
3) The unemployment rate is dependent on both job creation and the participation rate (both numbers from the household survey - payroll employment is from the establishment survey).
Usually the participation rate - the percent of the civilian population in the labor force - falls when the job market is weak. And a decline in the participation rate puts downward pressure on the unemployment rate (and the opposite is true when the participation rate increases).
Right now the participation rate is very low at 64.7%, and a further decline would be considered bad employment news (even if the unemployment rate declined slightly). An increase in the participation rate, combined with a weak labor market, could lead to a jump in the unemployment rate. This is something to watch closely.
4) In August the unemployment rate was 9.643% unrounded (reported as 9.6%), so it won't take much of an increase to reach the consensus 9.7% for September.
5) This will be the last employment report before the two day FOMC meeting on Nov 2nd and 3rd. Anything close to the consensus will probably all but guarantee QE2 (barring a significant upside surprise for Q3 GDP to be reported on October 29th).


