 RSS Feed
 by Calculated Risk on 9/27/2010 10:28:00 PM
Monday, September 27, 2010
Bank of England official to savers: 'Start spending'
From the Telegraph: Savers told to stop moaning and start spending
[Bank of England deputy governor Charles Bean said] "Savers shouldn't necessarily expect to be able to live just off their income in times when interest rates are low. It may make sense for them to eat into their capital a bit."In the U.K., savers are receiving about £18 billion a year less in interest. In the U.S., using the monthly personal interest income data from the BEA, interest income is off about $143 billion from the peak - and falling ...
...
Mr Bean said that encouraging Britons to spend was one reason why the Bank had cut interest rates.
WSJ: Fed Weighs new QE Approach
by Calculated Risk on 9/27/2010 06:20:00 PM
From Jon Hilsenrath at the WSJ: Fed Weighs New Tactics to Bolster Recovery
Rather than announcing massive bond purchases with a finite end, as they did in 2009 to shock the U.S. financial system back to life, Fed officials are weighing a more open-ended, smaller-scale program that they could adjust as the recovery unfolds.Although QE2 isn't a done deal, I think it is very likely.
This article suggests two approaches: 1) a large scale purchase program ( longer-term Treasury securities), or 2) a smaller-scale program with the amounts set at each FOMC meeting.
In Fed Chairman Ben Bernanke's speech at Jackson Hole on Aug 27th, he seemed to favor the first approach:
The channels through which the Fed's purchases affect longer-term interest rates and financial conditions more generally have been subject to debate. I see the evidence as most favorable to the view that such purchases work primarily through the so-called portfolio balance channel, which holds that once short-term interest rates have reached zero, the Federal Reserve's purchases of longer-term securities affect financial conditions by changing the quantity and mix of financial assets held by the public. ...It is possible that they could do the smaller-scale program as a compromise (note: Hilsenrath clearly has great sources at the Fed). As I noted yesterday in Bernanke and QE2, there will be plenty of economic data between now and the two day meeting on November 2nd and 3rd, but the two key releases are the September employment report (to be released on October 8th) and the Q3 GDP advance estimate (to be released on October 29th). Barring a significant upside surprise in one or both of those reports, it appears likely that QE2 will arrive in November.
The logic of the portfolio balance channel implies that the degree of accommodation delivered by the Federal Reserve's securities purchase program is determined primarily by the quantity and mix of securities the central bank holds or is anticipated to hold at a point in time (the "stock view"), rather than by the current pace of new purchases (the "flow view").
Now the question is how will they do QE2.
Report: Morgan Stanley Freezes Investment-Bank Hiring
by Calculated Risk on 9/27/2010 04:03:00 PM
Another sign of weaker Wall Street earnings ...
From Bloomberg: Morgan Stanley Said to Freeze Investment-Bank Hiring for 2010 (ht Brian)
Morgan Stanley, the sixth-largest U.S. bank by assets, froze hiring at its investment-banking division for the rest of 2010 ... The freeze, which includes the New York-based firm’s sales and trading units, comes as weak trading and equity underwriting volume may lead the five largest Wall Street banks to post their lowest revenue from investment banking and trading since the fourth quarter of 2008.This follows the weak results at Jefferies last week, from the Financial Times: Trading slump hits Jefferies earnings
In a preview of what might loom for investment banks, a sharp slowdown in trading activity led Jefferies to report its worst quarter since the market hit bottom last year.
Brazil’s finance minister: World in “international currency war”
by Calculated Risk on 9/27/2010 01:27:00 PM
From the Financial Times: Brazil warns of ‘currency war’
Guido Mantega, Brazil’s finance minister, said on Monday the world was in an “international currency war” ... Mr Mantega, who has made increasingly aggressive comments recently about the need to control Brazil’s currency, said governments around the world were trying to weaken their currencies to promote competitiveness.It seems everyone wants to devalue to export more.
"We’re in the midst of an international currency war, a general weakening of currency. This threatens us because it takes away our competitiveness,” he said ...
excerpt with permission
As a reminder, Bernanke touched on devaluation in his well known 2002 speech: Deflation: Making Sure "It" Doesn't Happen Here
Although a policy of intervening to affect the exchange value of the dollar is nowhere on the horizon today, it's worth noting that there have been times when exchange rate policy has been an effective weapon against deflation. A striking example from U.S. history is Franklin Roosevelt's 40 percent devaluation of the dollar against gold in 1933-34, enforced by a program of gold purchases and domestic money creation. The devaluation and the rapid increase in money supply it permitted ended the U.S. deflation remarkably quickly. Indeed, consumer price inflation in the United States, year on year, went from -10.3 percent in 1932 to -5.1 percent in 1933 to 3.4 percent in 1934.Bernanke also said in 2002:
I want to be absolutely clear that I am today neither forecasting nor recommending any attempt by U.S. policymakers to target the international value of the dollar.Of course a lower dollar only helps U.S. competitiveness with countries not pegged to the dollar - and not intervening in their currency. It sounds like Brazil might be intervening soon.
Dallas Fed: Manufacturing activity rose slightly in September
by Calculated Risk on 9/27/2010 10:30:00 AM
From the Dallas Fed: Texas Manufacturing Picks Up and Six-Month Outlook Improves
Texas factory activity rose slightly in September, according to business executives responding to the Texas Manufacturing Outlook Survey. The production index, a key measure of state manufacturing conditions, edged back into positive territory following a reading near zero in August.This report is at best mixed, especially with new orders down again.
Other factory activity indicators also improved in September. The new orders and shipments indexes remained negative for the fourth month in a row but moved up from their August levels. The growth rate of orders index jumped from –13 to zero, suggesting the pace of incoming orders may be stabilizing. Meanwhile, the September capacity utilization index climbed back into positive territory ...
Measures of general business conditions continued to worsen. The general business activity index pushed further negative this month, falling to –18. The company outlook index dipped back into negative territory, with 25 percent of firms reporting a worsened outlook, the highest share in more than a year.
Labor market indicators improved slightly in September. The employment index turned positive, up from a negative reading in August. Nineteen percent of respondents said they hired additional employees, while 17 percent noted layoffs. Hours worked were largely unchanged, while wages and benefits rose modestly.
The Richmond Fed survey will be released tomorrow and the Kansas City Fed survey on Thursday. Earlier this month, the Philly Fed survey showed contraction, the NY Fed survey showed manufacturing growth slowing.
The national ISM manufacturing survey will be released on Friday.
Chicago Fed: Economic activity weakened in August
by Calculated Risk on 9/27/2010 08:43:00 AM
Note: This is a composite index based on a number of economic releases.
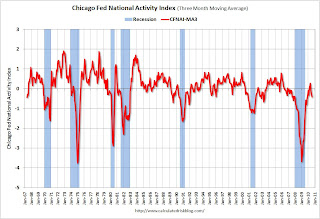
From the Chicago Fed: Index shows economic activity weakened in August
Led by declines in production- and employment-related indicators, the Chicago Fed National Activity Index decreased to –0.53 in August from –0.11 in July. None of the four broad categories of indicators that make up the index made a positive contribution in August.
The index’s three-month moving average, CFNAI-MA3, declined to –0.42 in August from –0.27 in July. August’s CFNAI-MA3 suggests that growth in national economic activity was below its historical trend. With regard to inflation, the amount of economic slack reflected in the CFNAI-MA3 suggests subdued inflationary pressure from economic activity over the coming year.
 Click on graph for larger image in new window.
This graph shows the Chicago Fed National Activity Index (three month moving average) since 1967. According to the Chicago Fed:
A zero value for the index indicates that the national economy is expanding at its historical trend rate of growth; negative values indicate below-average growth; and positive values indicate above-average growth.
Sunday, September 26, 2010
WSJ: 'Mr. Euro' Is Forced to Act
by Calculated Risk on 9/26/2010 11:07:00 PM
A 2nd part in the interesting back story on the European crisis: Currency Union Teetering, 'Mr. Euro' Is Forced to Act
[A] senior commission official, debating with the German delegation, tried to persuade [German Finance Minister Wolfgang Schäuble's deputy Jörg] Asmussen to let Brussels run the stabilization fund.And the article concludes:
"Why don't you let us handle this," he said.
"Because we do not trust you," Mr. Asmussen replied.
The deal allowed the ECB to press ahead with its bond-buying plan, and the package of EU measures has helped quell the panic. ... In the past month, financial markets have turned their sights on Ireland and Portugal. Doubts remain over the solvency of banks on Europe's stricken fringe. That leaves them dependent on Mr. Trichet's largesse, in the form of "temporary" lending facilities introduced by the ECB when the crisis first hit.Here was the first part: On the Secret Committee to Save the Euro, a Dangerous Divide
Despite Mr. Trichet's assurances that the bond-buying program is a stop-gap, it not only continues but has also increased in recent weeks—with no end in sight.
Clearly Germany was calling the shots.
Earlier:
Bernanke and QE2
by Calculated Risk on 9/26/2010 06:15:00 PM
On August 27th, Fed Chairman Bernanke gave a speech at the Jackson Hole symposium that might be worth reviewing. Note: I posted an analysis of the speech in August: Analysis: Bernanke paves the way to QE2
Although Bernanke pretty much stuck to the official forecast in his speech: "Despite the weaker data seen recently, the preconditions for a pickup in growth in 2011 appear to remain in place", he also outlined the requirements for further Fed policy action:
Under what conditions would the FOMC make further use of these or related policy tools? At this juncture, the Committee has not agreed on specific criteria or triggers for further action, but I can make two general observations.Now fast forward to the recent FOMC statement (see Sept 21 FOMC statement and Paving the way for QE2):
First, the FOMC will strongly resist deviations from price stability in the downward direction. ... It is worthwhile to note that, if deflation risks were to increase, the benefit-cost tradeoffs of some of our policy tools could become significantly more favorable.
Second, regardless of the risks of deflation, the FOMC will do all that it can to ensure continuation of the economic recovery. Consistent with our mandate, the Federal Reserve is committed to promoting growth in employment and reducing resource slack more generally. Because a further significant weakening in the economic outlook would likely be associated with further disinflation, in the current environment there is little or no potential conflict between the goals of supporting growth and employment and of maintaining price stability.
"Measures of underlying inflation are currently at levels somewhat below those the Committee judges most consistent, over the longer run, with its mandate to promote maximum employment and price stability."Remember, on August 27th, Bernanke said the FOMC would "strongly resist deviations from price stability in the downward direction". The above change to the FOMC strongly suggests additional policy action is coming.
...
[The FOMC] "is prepared to provide additional accommodation if needed to support the economic recovery and to return inflation, over time, to levels consistent with its mandate."
Also - the FOMC and staff forecasts will be presented this coming month, and these forecasts will probably be revised down again. That will probably meet the "significant weakening of the outlook" criteria.
In Bernanke's Jackson Hole speech he made his preference clear if the FOMC decided on additional monetary accommodation:
A first option for providing additional monetary accommodation, if necessary, is to expand the Federal Reserve's holdings of longer-term securities. As I noted earlier, the evidence suggests that the Fed's earlier program of purchases was effective in bringing down term premiums and lowering the costs of borrowing in a number of private credit markets. I regard the program (which was significantly expanded in March 2009) as having made an important contribution to the economic stabilization and recovery that began in the spring of 2009. Likewise, the FOMC's recent decision to stabilize the Federal Reserve's securities holdings should promote financial conditions supportive of recovery.And what does Bernanke think this will accomplish?
I believe that additional purchases of longer-term securities, should the FOMC choose to undertake them, would be effective in further easing financial conditions.
The channels through which the Fed's purchases affect longer-term interest rates and financial conditions more generally have been subject to debate. I see the evidence as most favorable to the view that such purchases work primarily through the so-called portfolio balance channel, which holds that once short-term interest rates have reached zero, the Federal Reserve's purchases of longer-term securities affect financial conditions by changing the quantity and mix of financial assets held by the public. Specifically, the Fed's strategy relies on the presumption that different financial assets are not perfect substitutes in investors' portfolios, so that changes in the net supply of an asset available to investors affect its yield and those of broadly similar assets. Thus, our purchases of Treasury, agency debt, and agency MBS likely both reduced the yields on those securities and also pushed investors into holding other assets with similar characteristics, such as credit risk and duration. For example, some investors who sold MBS to the Fed may have replaced them in their portfolios with longer-term, high-quality corporate bonds, depressing the yields on those assets as well.This probably pushes some investors into other assets as well, and historically quantitative easing has led to increases in asset prices in the short term. This is why I've been noting in the comments that "bad economic news" is perhaps "good stock market news" - since investors are now anticipating QE2 to be announced as early as November 3rd barring a sudden improvement in the news flow.
Although there will be plenty of economic data between now and the two day meeting on November 2nd and 3rd, the two key releases are the September employment report (to be released on October 8th) and the Q3 GDP advance estimate (to be released on October 29th). Barring a significant upside surprise in one or both of those reports, it appears QE2 might arrive as early as November.
Note:
Weekly Schedule for September 26th
by Calculated Risk on 9/26/2010 02:02:00 PM
The previous post is the Summary for Week ending Sept 25th
The key economic releases this week are the ISM Manufacturing index on Friday (and the regional releases earlier in the week), and the personal income and spending report for August (also on Friday). For housing, the key economic release is the S&P/Case-Shiller Home price index on Tuesday. There will be several Fed speeches this week to review for possible hints on QE2.
8:30 AM ET: Chicago Fed National Activity Index (August). This is a composite index of other data.
10:30 AM: Dallas Fed Manufacturing Survey for September. The Texas survey showed a slight contraction last month (at -0.1%), and is expected to show contraction again in September. These regional surveys are important now since it appears manufacturing is slowing (or contracting like the Philly Fed survey showed on Sept 16th).
9:00 AM: S&P/Case-Shiller Home Price Index for July. Although this is the July report, it is really a 3 month average of May, June and July. Prices probably started falling again in July, but the price declines might not show up in this report. The consensus is for flat prices month-over-month in July.
10:00 AM: Richmond Fed Survey of Manufacturing Activity for September. The consensus is for a decrease in the index to +6 (still expanding) from 11 last month.
10:00 AM: Conference Board's consumer confidence index for September. The consensus is for a decrease to 52 from 53.5 last month. This is down sharply from May, and at about the same level as a year ago.
5:30 PM: Atlanta Fed President Dennis Lockhart speaks on the economic outlook.
7:00 AM: The Mortgage Bankers Association (MBA) will release the mortgage purchase applications index. This index declined sharply following the expiration of the tax credit, and the index has only recovered slightly over the last couple months - suggesting reported home sales through at least October will be very weak.
Fed Speeches: Minneapolis Fed President Narayana Kocherlakota, Philly Fed President Charles Plosser and Boston Fed President Eric Rosengren are all scheduled to speak. With QE2 clearly on the radar, these speeches will be closely watched.
8:30 AM: The initial weekly unemployment claims report will be released. Consensus is for a decline to 459,000 from 465,000 last week.
8:30 AM: Q2 GDP (third estimate). The consensus is for no change from the previous report (1.6% real annualized GDP growth in Q2).
9:45 AM: Chicago Purchasing Managers Index for September. The consensus is for a decline to 56.0 from 56.7 in August.
10:00 AM: Fed Chairman Ben Bernanke testifies on the Implementation of the Dodd-Frank Act before the Senate Committee on Banking, Housing, and Urban Affairs, U.S. Sentate
11:00 AM: Kansas City Fed regional Manufacturing Survey for September. The index declined sharply in August to 0 from 14 in July.
8:30 AM: Personal Income and Outlays for August. The concensus is for a 0.3% increase in personal income and a 0.4% increase in personal spending. Using this data we can obtain an early estimate for Q3 real PCE growth (annualized) using the two-month method (usually pretty close).
8:30 AM: New York Fed President William Dudley speaks at the SABEW conference in New York.
9:55 AM: Reuter's/University of Michigan's Consumer sentiment index (final for September). Consensus is for a slight increase 67.0 from the mid-month reading of 66.6.
10:00 AM: ISM Manufacturing Index for September. The consensus is for a decline to 54.5 from 56.3 in August.
10:00 AM: Construction Spending for August. The consensus is for a 0.4% decline in construction spending.
All day: Light vehicle sales for September. The manufacturers will report vehicle sales for September. Light vehicle sales are expected to increase slightly in September to around 11.6 million (Seasonally Adjusted Annual Rate), from 11.44 million in August.
After 4:00 PM: The FDIC might have another busy Friday afternoon ...
Summary for Week ending Sept 25th
by Calculated Risk on 9/26/2010 09:27:00 AM
A summary of last week - mostly in graphs.
There were a few key non-graphical stories this week: Fed Chairman Ben Bernanke expressed concern about the recovery, suggesting to many that QE2 will arrive in early November, Larry Summers is leaving the Obama Administration, the NBER announced the end date for the recent recession (June 2009), and the corporate credit union bailout was announced (coming for some time).
There are links for all of these stories and more at the bottom of this post.
The Census Bureau reported New Home Sales in August were at a seasonally adjusted annual rate (SAAR) of 288 thousand. This was unchanged from July.
 Click on graph for larger image in new window.
The first graph shows monthly new home sales (NSA - Not Seasonally Adjusted or annualized).
Note the Red columns for 2010. In August 2010, 25 thousand new homes were sold (NSA). This is a new record low for August.
The previous record low for the month of August was 34 thousand in 1981; the record high was 110 thousand in August 2005.
 The second graph shows New Home Sales vs. recessions for the last 47 years. The dashed line is the current sales rate.
 Sales of new single-family houses in August 2010 were at a seasonally adjusted annual rate of 288,000.
And another long term graph - this one for New Home Months of Supply.
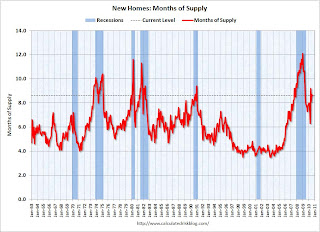 Months of supply decreased to 8.6 in August from 8.7 in July. The all time record was 12.4 months of supply in January 2009. This is still very high (less than 6 months supply is normal).
The 288 thousand annual sales rate for August is just above the all time record low in May (282 thousand). This was another very weak report. New home sales are important for the economy and jobs - and this indicates that residential investment will be a sharp drag on GDP in Q3.
The NAR reported: Existing-Home Sales Move Up in August
 This graph shows existing home sales, on a Seasonally Adjusted Annual Rate (SAAR) basis since 1993.
 Sales in August 2010 (4.13 million SAAR) were 7.6% higher than last month, and were 19.0% lower than August 2009 (5.1 million SAAR).
The next graph shows the year-over-year (YoY) change in reported existing home inventory and months-of-supply. Inventory is not seasonally adjusted, so it really helps to look at the YoY change.
 Although inventory decreased slightly from July 2010 to August 2010, inventory increased 1.5% YoY in August.
 Note: Usually July is the peak month for inventory.
The year-over-year increase in inventory is especially bad news because the reported inventory is already historically very high (around 4 million), and the 11.6 months of supply in August is far above normal.
The National Association of Home Builders (NAHB) reported the housing market index (HMI) was at 13 in September. This is the same low level as in August and below expectations. The record low was 8 set in January 2009, and 13 is very low ...
Note: any number under 50 indicates that more builders view sales conditions as poor than good.
 This graph compares the NAHB HMI (left scale) with single family housing starts (right scale). This includes the September release for the HMI and the July data for starts (August starts were released after this report).
This shows that the HMI and single family starts mostly move in the same direction - although there is plenty of noise month-to-month.
Press release from the NAHB: Builder Confidence Unchanged in September
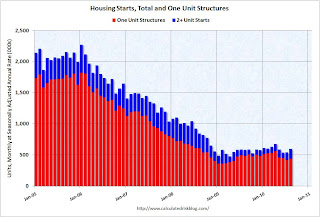 Total housing starts were at 598 thousand (SAAR) in August, up 10.5% from the revised July rate of 541 thousand (revised down from 546 thousand), and up 25% from the all time record low in April 2009 of 477 thousand (the lowest level since the Census Bureau began tracking housing starts in 1959).
 Single-family starts increased 4.3% to 438 thousand in August. This is 22% above the record low in January 2009 (360 thousand).
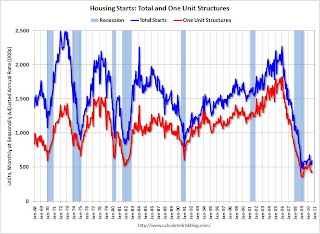 The second graph shows total and single unit starts since 1968. This shows the huge collapse following the housing bubble, and that housing starts have mostly been moving sideways for over a year - with a slight up and down over the last several months due to the home buyer tax credit.
Here is the Census Bureau report on housing Permits, Starts and Completions.
This was above expectations of 550 thousand, mostly because of the volatile multi-family starts. This low level of starts is good news for the housing market longer term (there are too many housing units already), but bad news for the economy and employment short term.
Note: This index is a leading indicator for new Commercial Real Estate (CRE) investment.
Reuters reports that the American Institute of Architects’ Architecture Billings Index increased to 48.2 in August from 47.9 in July. Any reading below 50 indicates contraction.
 This graph shows the Architecture Billings Index since 1996. The index has remained below 50, indicating falling demand, since January 2008.
According to the AIA, there is an "approximate nine to twelve month lag time between architecture billings and construction spending" on non-residential construction. So there will probably be further declines in CRE investment into 2011.
Moody's reported today that the Moody’s/REAL All Property Type Aggregate Index declined 3.1% in July. This is a repeat sales measure of commercial real estate prices.
Below is a comparison of the Moodys/REAL Commercial Property Price Index (CPPI) and the Case-Shiller composite 20 index.
Notes: Beware of the "Real" in the title - this index is not inflation adjusted. Moody's CRE price index is a repeat sales index like Case-Shiller - but there are far fewer commercial sales - and that can impact prices.
 CRE prices only go back to December 2000.
The Case-Shiller Composite 20 residential index is in blue (with Dec 2000 set to 1.0 to line up the indexes).
It is important to remember that the number of transactions is very low and there are a large percentage of distressed sales.
The index is now down 43.2% from the peak in October 2007. And the index is only 0.9% above the October 2009 low.
Best wishes to all.


