 RSS Feed
 by Calculated Risk on 9/26/2010 09:27:00 AM
Sunday, September 26, 2010
Summary for Week ending Sept 25th
A summary of last week - mostly in graphs.
There were a few key non-graphical stories this week: Fed Chairman Ben Bernanke expressed concern about the recovery, suggesting to many that QE2 will arrive in early November, Larry Summers is leaving the Obama Administration, the NBER announced the end date for the recent recession (June 2009), and the corporate credit union bailout was announced (coming for some time).
There are links for all of these stories and more at the bottom of this post.
The Census Bureau reported New Home Sales in August were at a seasonally adjusted annual rate (SAAR) of 288 thousand. This was unchanged from July.
 Click on graph for larger image in new window.
The first graph shows monthly new home sales (NSA - Not Seasonally Adjusted or annualized).
Note the Red columns for 2010. In August 2010, 25 thousand new homes were sold (NSA). This is a new record low for August.
The previous record low for the month of August was 34 thousand in 1981; the record high was 110 thousand in August 2005.
 The second graph shows New Home Sales vs. recessions for the last 47 years. The dashed line is the current sales rate.
 Sales of new single-family houses in August 2010 were at a seasonally adjusted annual rate of 288,000.
And another long term graph - this one for New Home Months of Supply.
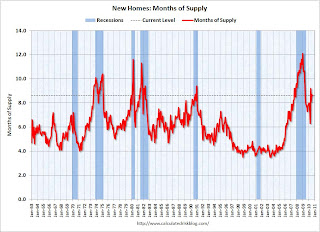 Months of supply decreased to 8.6 in August from 8.7 in July. The all time record was 12.4 months of supply in January 2009. This is still very high (less than 6 months supply is normal).
The 288 thousand annual sales rate for August is just above the all time record low in May (282 thousand). This was another very weak report. New home sales are important for the economy and jobs - and this indicates that residential investment will be a sharp drag on GDP in Q3.
The NAR reported: Existing-Home Sales Move Up in August
 This graph shows existing home sales, on a Seasonally Adjusted Annual Rate (SAAR) basis since 1993.
 Sales in August 2010 (4.13 million SAAR) were 7.6% higher than last month, and were 19.0% lower than August 2009 (5.1 million SAAR).
The next graph shows the year-over-year (YoY) change in reported existing home inventory and months-of-supply. Inventory is not seasonally adjusted, so it really helps to look at the YoY change.
 Although inventory decreased slightly from July 2010 to August 2010, inventory increased 1.5% YoY in August.
 Note: Usually July is the peak month for inventory.
The year-over-year increase in inventory is especially bad news because the reported inventory is already historically very high (around 4 million), and the 11.6 months of supply in August is far above normal.
The National Association of Home Builders (NAHB) reported the housing market index (HMI) was at 13 in September. This is the same low level as in August and below expectations. The record low was 8 set in January 2009, and 13 is very low ...
Note: any number under 50 indicates that more builders view sales conditions as poor than good.
 This graph compares the NAHB HMI (left scale) with single family housing starts (right scale). This includes the September release for the HMI and the July data for starts (August starts were released after this report).
This shows that the HMI and single family starts mostly move in the same direction - although there is plenty of noise month-to-month.
Press release from the NAHB: Builder Confidence Unchanged in September
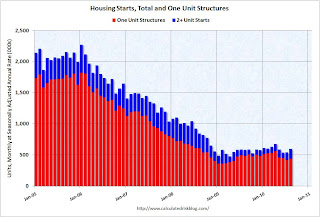 Total housing starts were at 598 thousand (SAAR) in August, up 10.5% from the revised July rate of 541 thousand (revised down from 546 thousand), and up 25% from the all time record low in April 2009 of 477 thousand (the lowest level since the Census Bureau began tracking housing starts in 1959).
 Single-family starts increased 4.3% to 438 thousand in August. This is 22% above the record low in January 2009 (360 thousand).
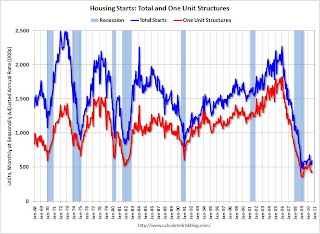 The second graph shows total and single unit starts since 1968. This shows the huge collapse following the housing bubble, and that housing starts have mostly been moving sideways for over a year - with a slight up and down over the last several months due to the home buyer tax credit.
Here is the Census Bureau report on housing Permits, Starts and Completions.
This was above expectations of 550 thousand, mostly because of the volatile multi-family starts. This low level of starts is good news for the housing market longer term (there are too many housing units already), but bad news for the economy and employment short term.
Note: This index is a leading indicator for new Commercial Real Estate (CRE) investment.
Reuters reports that the American Institute of Architects’ Architecture Billings Index increased to 48.2 in August from 47.9 in July. Any reading below 50 indicates contraction.
 This graph shows the Architecture Billings Index since 1996. The index has remained below 50, indicating falling demand, since January 2008.
According to the AIA, there is an "approximate nine to twelve month lag time between architecture billings and construction spending" on non-residential construction. So there will probably be further declines in CRE investment into 2011.
Moody's reported today that the Moody’s/REAL All Property Type Aggregate Index declined 3.1% in July. This is a repeat sales measure of commercial real estate prices.
Below is a comparison of the Moodys/REAL Commercial Property Price Index (CPPI) and the Case-Shiller composite 20 index.
Notes: Beware of the "Real" in the title - this index is not inflation adjusted. Moody's CRE price index is a repeat sales index like Case-Shiller - but there are far fewer commercial sales - and that can impact prices.
 CRE prices only go back to December 2000.
The Case-Shiller Composite 20 residential index is in blue (with Dec 2000 set to 1.0 to line up the indexes).
It is important to remember that the number of transactions is very low and there are a large percentage of distressed sales.
The index is now down 43.2% from the peak in October 2007. And the index is only 0.9% above the October 2009 low.
Best wishes to all.


