 RSS Feed
 by Calculated Risk on 8/15/2010 03:20:00 PM
Sunday, August 15, 2010
Weekly Schedule for August 15th
Note: Earlier I posted the summary of last week. I'm going to split the summary and schedule into two posts because it was getting too long!
Two key housing reports will be released this week: July housing starts (Tuesday) and August homebuilder confidence (Monday). Also the Fed will release July industrial production and capacity utilization (Tuesday).
8:30 AM ET: Empire State Manufacturing Survey (August). This index fell sharply over the last few months, although it still showed expansion. The consensus is for a slight increase in August to 8.0 from 5.1 in July.
10 AM: The August NAHB homebuilder survey. This index has collapsed since the expiration of the home buyer tax credit. The consensus is for a slight increase to 15 from 14 in July (still very depressed).
8:30 AM: Housing Starts for July. Housing starts collapsed in June following the expiration of the tax credit. The consensus is for a slight increase to 565K (SAAR) in July from 549K in June.
8:30 AM: Producer Price Index for July. The consensus is for a 0.2% increase, and +0.1% for core PPI.
9:15 AM: The Fed will release Industrial Production and Capacity Utilization for July. The consensus is for a 0.5% increase in Industrial Production, and an increase to 74.5% (from 74.1%) for Capacity Utilization.
9:00 AM to 1:30 PM: Conference on the Future of Housing Finance. According to the agenda: "This event will provide a forum for public input as the Administration continues its work developing a comprehensive housing finance reform proposal for delivery to Congress by January 2011."
12:30 PM: Minneapolis Fed President Narayana Kocherlakota speaks about the FOMC at Northern University of Michigan.
Note: The Q2 Quarterly Starts and Completions by Purpose and Design will also be released
Early: The AIA's Architecture Billings Index for July will be released (a leading indicator for commercial real estate). This has been showing ongoing contraction, and usually this leads investment in non-residential structures (hotels, malls, office) by 9 to 12 months.
7:00 AM: The Mortgage Bankers Association (MBA) will release the mortgage purchase applications index. This index declined sharply following the expiration of the tax credit, and the index has only recovered slightly over the last few weeks - suggesting reported home sales in July and August will be very weak.
8:30 AM: The initial weekly unemployment claims report will be released. Consensus is for a slight decrease to 480K from 484K last week. If so, this will push the 4-week average to the highest level this year.
10:00 AM: Conference Board's index of leading indicators for July. The consensus is for a 0.1% increase in this index.
10:00 AM: Philly Fed Survey for August. This survey declined sharply over the last two months, although was still showing expansion (at a slower pace). The consensus is for a slight increase to 7.0 from 5.1 in July (still expanding, but slowly).
Lunch: St Louis Federal President James Bullard speaks on the economic outlook, and Chicago Fed President Charles Evans speaks to reporters.
10:00 AM: the BLS will release the Regional and State Employment and Unemployment report for June.
After 4:00 PM: The FDIC will probably have another busy Friday afternoon ...
Making Home Affordable Program (HAMP) for July and the “Housing Scorecard”
CoreLogic House Price Index for June.
Moodys/REAL Commercial Property Price Index (CPPI) for June.
Weekly Summary August 15th
by Calculated Risk on 8/15/2010 11:45:00 AM
Note: I'm going to split the weekly summary and the schedule for the coming week into two posts - sometimes one post was too long!
The big story of last week was that the Fed acknowledged the weaker U.S. economy and announced that they will reinvest maturing MBS into Treasury securities.
From the FOMC statement:
[T]he pace of recovery in output and employment has slowed in recent months [and] the pace of economic recovery is likely to be more modest in the near term than had been anticipated.The Fed's goal (according to the technical note from the NY Fed) is to "maintain the face value of outright holdings of domestic securities" at approximately $2.054 trillion.
...
[T]he Committee will keep constant the Federal Reserve's holdings of securities at their current level by reinvesting principal payments from agency debt and agency mortgage-backed securities in longer-term Treasury securities.
 Click on graph for larger image in new window.
The red line on this graph is the amount of outright holdings on the Fed's balance sheet. The dashed line is the new target level for quantitative neutrality.
The outright holdings were expected to fall by about $200 billion by the end of 2011 (some have estimated as high as $400 billion), and that would represent tightening in the face of high unemployment and below target inflation.
NY Fed FAQs: Reinvestment of Principal Payments on Agency Debt and Agency Mortgage-Backed Securities in Treasuries
And from the NY Fed: New York Fed Plans to Buy $18 billion in Treasuries over the next month
On a monthly basis, retail sales increased 0.4% from June to July (seasonally adjusted, after revisions), and sales were up 5.5% from July 2009. Retail sales increased 0.2% ex-autos.
 This graph shows retail sales since 1992.
 This is monthly retail sales, seasonally adjusted (total and ex-gasoline).
Retail sales are up 8.1% from the bottom, but still off 4.5% from the pre-recession peak.
This was close to expectations, but retail sales are still below the March 2010 level (moving sideways for four months).
The combined REO (Real Estate Owned) inventory for Fannie, Freddie and the FHA increased by 13% in Q2 2010 from Q1 2010. The REO inventory (lender Real Estate Owned) increased 74% compared to Q2 2009 (year-over-year comparison).
 This graph shows the REO inventory for Fannie, Freddie and FHA through Q2 2010.
The REO inventory for the "Fs" has increased sharply over the last year, from 135,868 at the end of Q2 2009 to 236,338 at the end of Q2 2010.
This is a new record for Fannie and Freddie; the FHA's REO inventory decreased slightly in Q2 2010.
Remember this is just a portion of the total REO inventory. Private label securities (PLS) and banks and thrifts also hold a substantial number of REOs.
From Diana Olick at CNBC: Foreclosure Math: Shadow Inventory Adds Up
Moody's estimates that private label repossessions stand at 203,665. ... "My best guess right now is that REO held by Fannie, Freddie, and FHA, and other government entities, and banks and thrifts is just under 600-thousand, but unfortunately it is on the rise," says [Thomas] Lawler.
The Census Bureau reports:
[T]otal June exports of $150.5 billion and imports of $200.3 billion resulted in a goods and services deficit of $49.9 billion, up from $42.0 billion in May, revised.This graph shows the U.S. trade deficit, with and without petroleum, through June.
 The blue line is the total deficit, and the black line is the petroleum deficit, and the red line is the trade deficit ex-petroleum products.
The increase in the deficit in June was unrelated to oil as the trade gap with China increased to $26.15 billion in June - the highest level since October 2008 and up sharply from last year.
Once again the imbalances have returned ... and July will probably be worse (see LA Port Traffic: Imports increase, Exports Flat)
From the Association of American Railroads: Rail Time Indicators. The AAR reports traffic in July 2010 was up 4.1% compared to July 2009 - and traffic was 14.6% lower than in July 2008.
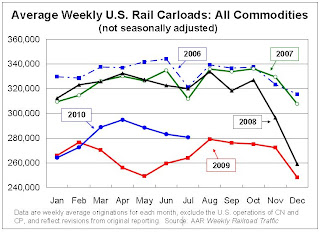 This graph shows U.S. average weekly rail carloads (NSA). Traffic increased in 14 of 19 major commodity categories year-over-year.
As the graph above shows, rail traffic collapsed in November 2008, and now, a year into the recovery, traffic has only recovered part way.
Seasonally there is usually a decline in traffic in July, so seasonally adjusted traffic increased last month. However traffic is only up 4.1% compared to July 2009.
From the National Federation of Independent Business (NFIB): Small Business Economic Trends
 NFIB reported its optimism index fell 0.9 point to 88.1 in July. (Graph from NFIB)
Note: A large percentage of small businesses are in real estate related fields and that will keep optimism down.
And once again the key problem is lack of demand.
Best wishes to all.
Update on Tighter FHA Lending Standards
by Calculated Risk on 8/15/2010 08:54:00 AM
Last month, on July 15th, HUD filed a public notice in the Federal Register of tighter FHA lending requirements. The 30 day comment period is over.
Jennifer Waters at the WSJ writes: FHA Gets Tougher on Mortgages
Consumers looking for home loans backed by the Federal Housing Administration will face tougher hurdles and higher costs under new legislation and new rules that could take effect as soon as this month.The changes could happen this week.
As a review, the changes included (from HUD):
1. Update the combination of credit and down payment requirements for new borrowers. New borrowers seeking FHA-insured financing will be required to have a minimum FICO score of 580 to qualify for FHA’s flagship 3.5 percent down payment program. New borrowers with credit scores of less than a 580 will be required to make a cash investment of at least 10 percent. Borrowers with credit scores of less than 500 will no longer qualify for an FHA-insured mortgage.
2. Reduce allowable seller concessions from six to three percent. Allowing sellers to contribute up to six percent of the home’s sales price to offset a buyer’s costs exposes the FHA to excess risk by potentially driving up the cost of the home beyond its appraised value. Reducing seller concessions to three percent will bring FHA into conformity with industry standards.
3. Tighten underwriting standards for manually underwritten loans. When using compensating factors in the underwriting process, lenders will be required to consider those factors which are the best predictive indicators of loan performance, such as the borrower’s credit history, loan-to-value (LTV) percentage, debt-to income ratio, and cash reserves.
Saturday, August 14, 2010
Inflation Graph
by Calculated Risk on 8/14/2010 10:54:00 PM
Since I didn't post an inflation graph when CPI was released, here is one for a Saturday night: Click on graph for larger image in new window.
This graph shows three measure of inflation, Core CPI, Median CPI (from the Cleveland Fed), and 16% trimmed CPI (also from Cleveland Fed).
They all show that inflation has been falling, and that measured inflation is up less than 1% year-over-year. Core CPI, median CPI, and the 16% trimmed mean CPI were all up 0.1% in July.
Note: The Cleveland Fed has a discussion of a number of measures of inflation: Measuring Inflation
Why do I expect the unemployment rate to increase?
by Calculated Risk on 8/14/2010 05:21:00 PM
This morning, in the "Negative News Flow" post, I noted that the unemployment rate will probably start ticking up again soon.
Here are a few reasons why I think the unemployment rate will increase (some overlap):
1) The main reason is the general slowing economy. There is a general relationship between GDP and the unemployment rate (see Okun's Law), and since I expect a 2nd half slowdown (from a sluggish 1st half), I also expect few payroll jobs to be added in the 2nd half - and that suggests the unemployment rate will rise.
2) With the end of the housing tax credit, I expect residential construction employment to decline further over the next few months.
3) The 4-week average for initial weekly unemployment claims has increased recently. This is the highest level since February. Click on graph for larger image in new window.
This graph shows the 4-week moving average of weekly claims since January 2000.
The four-week average of weekly unemployment claims increased this week by 14,250 to 473,500.
The dashed line on the graph is the current 4-week average. This is the highest level since February and suggests weakness in the labor market.
4) Few teens joined the labor force this summer. Perversely this low level of teen participation appeared to push down the seasonally adjusted unemployment rate. If this did impact the unemployment rate (it isn't clear), the impact will be unwound over the next couple of months.
5) The Labor Force Participation Rate decreased from 65.0% in May to 64.6% in July. This was a key reason the unemployment rate decline to 9.5% in June from 9.7% in May.
Some of this decline in the participation rate might be related to the expiration of the Federal unemployment benefits - some people whose benefits expired, and were unable to move on to the next tier, might have just given up. Note: this isn't an argument against unemployment benefits!
Just over a week ago the qualification dates for the various tiers of Federal unemployment benefits have been extended through November 30th. This extension was also made retroactive to June 2nd. Some people who have given up might rejoin the labor force to collect additional benefits. If this happens, the participation rate might increase in August - and that will probably push up the unemployment rate.
Unofficial Problem Bank List increases to 813 institutions
by Calculated Risk on 8/14/2010 01:25:00 PM
Note: this is an unofficial list of Problem Banks compiled only from public sources.
Here is the unofficial problem bank list for August 13, 2010.
Changes and comments from surferdude808:
The Unofficial Problem Bank List finishes the week at 813 institutions with aggregate assets of $417.8 billion.Note: The FDIC Q2 2010 Quarterly Banking Profile will be released the week of August 22nd.
The sole removal is the failed Palos Bank and Trust Company ($496 million).
There are four additions this week -- The Brand Banking Company, Lawrenceville, GA ($1.2 billion); Broadway Federal Bank, f.s.b, Los Angeles, CA ($530 million Ticker: BYFC); Liberty Savings Bank, FSB, Whiting, IN ($82 million); and Home Savings Bank, Jefferson, MO ($31 million).
The other change to report is a Prompt Corrective Action Order issued by the Federal Reserve against Paramount Bank ($283 million).
We anticipate the OCC will release its enforcement actions for July 2010 next Friday.


