 RSS Feed
 by Calculated Risk on 8/12/2010 11:46:00 AM
Thursday, August 12, 2010
Agenda for August 17th conference on the Future of Housing Finance
The Obama Administration announced the panelists and agenda for the August 17th conference: Conference on the Future of Housing Finance
This event will provide a forum for public input as the Administration continues its work developing a comprehensive housing finance reform proposal for delivery to Congress by January 2011.
Freddie Mac: 30 Year Mortgages Rates fall to series record low
by Calculated Risk on 8/12/2010 10:50:00 AM
From MarketWatch: Freddie Mac: Fixed-rate mortgages at record lows
Freddie Mac said Thursday the 30-year fixed-rate mortgage average fell to record low of 4.44% with an average 0.7 point for the week ending Aug. 12. In the previous period, the average was 4.49% ...This calls for a long term graph ...
 Click on graph for larger image in new window.
This graph shows the 30 year fixed rate mortgage interest rate based on the Freddie Mac survey since 1971.
The decline in mortgage rates is related to the weak economy and falling Treasury yields. Rates will probably fall again this week with the Ten Year Treasury yield down to 2.7%.
Note: this series only goes back to 1971. Mortgage rates were at or below 5% back in the 1950s.
Weekly Initial Unemployment Claims increase, Highest since February
by Calculated Risk on 8/12/2010 08:30:00 AM
The DOL reports on weekly unemployment insurance claims:
In the week ending Aug. 7, the advance figure for seasonally adjusted initial claims was 484,000, an increase of 2,000 from the previous week's revised figure of 482,000. The 4-week moving average was 473,500, an increase of 14,250 from the previous week's revised average of 459,250.
...
The advance number for seasonally adjusted insured unemployment during the week ending July 31 was 4,452,000, a decrease of 118,000 from the preceding week's revised level of 4,570,000.
 Click on graph for larger image in new window.
This graph shows the 4-week moving average of weekly claims since January 2000.
The four-week average of weekly unemployment claims increased this week by 14,250 to 473,500.
The dashed line on the graph is the current 4-week average. The 4-week average of initial weekly claims is at the highest level since February, and suggests further weakness in the labor market.
Wednesday, August 11, 2010
NY Times: Borrowers refuse to pay home equity loans
by Calculated Risk on 8/11/2010 10:50:00 PM
Some interesting anecdotes from David Streitfeld at the NY Times: Bad Debts Rise as Bust Erodes Home Equity
Lenders say they are trying to recover some of that money but their success has been limited, in part because so many borrowers threaten bankruptcy and the collateral in the homes backing the loans has often disappeared.
The result is one of the paradoxes of the recession: the more money you borrowed, the less likely you will have to pay up.
Cisco Comments: Mixed Signals, Recovery has slowed
by Calculated Risk on 8/11/2010 06:45:00 PM
A few excerpts from the Cisco Conference call (ht Brian):
“... there are some challenges that are contributing to an unusual amount of conservatism and even caution. In short, we see the same opportunities and challenges that you are reading about in regards to the market, those challenges ranging from GDP growth and future GDP projections continuing to flow in the US, job creation challenges, and concerns coming out of Europe just to mention a few. We are seeing a large number of mixed signals in both the market and from our customers' expectations, and we think the words unusual uncertainty are an accurate description of what is occurring. The Federal Reserve's comments yesterday that the pace and output of the recovery has slowed in recent months and that the recovery is likely to be more modest in the near term then has been anticipated just a few months ago, are comments that most of our large customers that I have talked with recently would agree with. Also, the same customers would agree with few exceptions that they still expect a very gradual return to more normal economic conditions.”Cisco's quarter ends July 31st, and they saw weakness in late June and into July that most of the other tech companies missed (most end Q2 on June 30th). Investment in equipment and software has been one of the strongest components of GDP, and Cisco's comments suggest this investment is slowing.
...
As has been our standing practice for some time, we are continuing to provide detailed quarterly guidance one quarter at a time. In light of the unusual uncertainty in the macro environment, including the comments we heard from the Federal Reserve yesterday, we encourage you to continue to model conservatively, especially in the short term. It is important that expectations do not get ahead of where the market is today. We do intend to budget in two halves for our fiscal year and will obviously be conservative, and we would suggest you do the same.
...
What are the areas that [we] have the most concern about? The answer for me this quarter is, I am concerned about what my customers are concerned about. And most of these customer concerns are centered on what they view as mixed signals in their business environment, therefore, their strategy in the short-term in terms of investments and projections for their businesses. As an example, the economy continues to be on the wild card in many customers' minds. We are all aware of GDP growth in the US slowing from 5% to 3.7% to 2.4% over the last three quarters. Many of the customers we talk with are anticipating growth of only 2% or so in the second half of the calendar year. Yet, at the same time, many of these same customers are seeing steadily improving results in their own companies. But when you press them on their comfort level to predict either of these trends over the next year, candidly many of them are not comfortable at all. This is this one of the many examples of today's uncertainty and environment that we are -- that is sending such mixed signals to us and others about the customer's capital spending and job creation intention over the next year. Another example of mixed signals would be our own product order pattern for Q4. On first review, the 23% year-over-year growth in product orders was obviously very strong, and the monthly results, which we tend to follow in terms of linearity, were well within our normal expectations in each of the three months in Q4. In fact, actually almost exactly on as a percentage of what we would have expected in each month. However, several of our customers shared with me that they saw a softening in their business in the second half of June and early July. Upon review, we saw a similar pattern of approximately four to five weeks from mid-June to mid-July where the normal order growth rates were off over 10 points versus our quarter's 23% average. Normally I would not have paid much attention to this, except this is the exact time period where we saw the challenges in Europe and the corresponding challenges in global stock markets. Then, just as the quarter had started in May, the end of July was very strong, well above average for the quarter in terms of year-over-year growth rates from an order perspective.
Ceridian-UCLA: Diesel Fuel index increases in July
by Calculated Risk on 8/11/2010 04:30:00 PM
This is the new UCLA Anderson Forecast and Ceridian Corporation index using real-time diesel fuel consumption data: Pulse of Commerce IndexTM
Press Release: PCI Climbs in July, Confirming Economy’s Slow but Steady Recovery
All signs continue to point to an economy in recovery with the latest release of the Ceridian-UCLA Pulse of Commerce Index™ (PCI) by UCLA Anderson School of Management. The July PCI climbed 1.7 percent after dropping 1.9 percent in June.
...
“The key takeaway from the July report is that the economy continues to recover – which is encouraging – but the pace needs to substantially pick up to put people back to work,” said Ed Leamer, chief PCI economist. “With the unemployment rate still at 9.5 percent and consumers understandably nervous about opening their wallets, it is hard to be very optimistic about economic growth. On the other hand, there is nothing about the PCI that is supportive of the pessimistic double-dip view.”
...
The PCI is based on an analysis of real-time diesel fuel consumption data from over the road trucking tracked by Ceridian ...
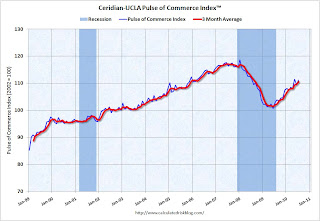 Click on graph for larger image in new window.
This graph shows the index since January 1999.
This is a new index and doesn't have much of a track record in real time - although it appears to suggest that the sluggish recovery was continuing in July.


