 RSS Feed
 by Calculated Risk on 8/09/2010 09:24:00 PM
Monday, August 09, 2010
REO Inventory including private-label RMBS
Earlier I posted a graph of Fannie, Freddie and FHA inventory (new record total in Q2).
Economist Tom Lawler has added private-label RMBS REO in the following graph.
Note: The private-label securities have one advantage - they essentially stopped making new loans in mid-2007! (see Figure 3 from San Francisco Fed Senior Economist John Krainer: Recent Developments in Mortgage Finance)
Update: The private-label securities are the ones securitized by Wall Street. This was the worst of the worst securities. Click on graph for larger image in new window.
From Tom Lawler:
As the chart indicates, the SF REO inventory of “the F’s” has increased sharply since the end of 2008, while the SF REO inventory held in private-label RMBS has fallen considerably. This chart, of course, does NOT include anything close to all REO, as SF REO properties owned by banks, thrifts, credit unions, VA, USDA, finance companies, and “other” mortgage lenders/investors are not included.
Rail Traffic increases 4.1% in July compared to July 2009
by Calculated Risk on 8/09/2010 04:15:00 PM
From the Association of American Railroads: Rail Time Indicators. The AAR reports traffic in July 2010 was up 4.1% compared to July 2009 - and traffic was 14.6% lower than in July 2008.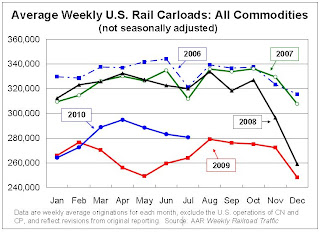 Click on graph for larger image in new window.
This graph shows U.S. average weekly rail carloads (NSA). Traffic increased in 14 of 19 major commodity categories year-over-year.
From AAR:
• U.S. freight railroads originated 1,122,308 carloads in July 2010, an average of 280,577 carloads per week — up 4.1% from July 2009 (see chart) but down 14.6% from July 2008 on a non-seasonally adjusted basis.As the graph above shows, rail traffic collapsed in November 2008, and now, a year into the recovery, traffic has only recovered part way.
• On a seasonally adjusted basis, U.S. rail carloads rose 3.2% in July 2010 from June 2010 after falling 1.2% in June 2010 and 0.9% in May 2010. The seasonally adjusted weekly average of 289,320 carloads in July 2010 was the highest such figure since November 2008.
excerpts with permission
Seasonally there is usually a decline in traffic in July, so seasonally adjusted traffic increased last month. However traffic is only up 4.1% compared to July 2009.
Miscellaneous Reading: Helicopter drops, Personal Income Declines, Recession Probabilities
by Calculated Risk on 8/09/2010 02:24:00 PM
A few articles of interest ...
Personal income declined in 2009 in most of the nation’s metropolitan statistical areas (MSAs), according to estimates released today by the U.S. Bureau of Economic Analysis.The per capita income in my MSA fell 3.8% last year.
An unstable economic environment has rekindled talk of a double-dip recession. The Conference Board’s Leading Economic Index provides data for predicting the probability of a recession but is limited by the weight assigned to its indicators and the varying efficacy of those indicators over different time horizons. Statistical experiments with LEI data can mitigate these limitations and suggest that a recessionary relapse is a significant possibility sometime in the next two years.The authors make some adjustment to the LEI, including removing the yield curve:
However, the term structure may not presently be an accurate signal. Monetary policy has been operating near the zero lower bound to provide maximum monetary stimulus. In addition, the Greek fiscal crisis has generated a considerable flight to quality that has pushed down yields on U.S. Treasury securities. Indeed, ... omitting the rate-spread indicator generates far more pessimistic forecasts. For the period 18 to 24 months in the future, the probability of recession goes above 0.5, putting the odds of recession slightly above the odds of expansion.
There is quite a bit about deflaton and monetary policy in this 1999 paper from Ben Bernanke, including arguing for a higher inflation target of 3% to 4%. Bernanke even made some "helicopter drop" comments before his well known speech in 2002: Deflation: Making Sure "It" Doesn't Happen Here
From the 1999 paper:
An alternative strategy, which does not rely at all on trade diversion, is money-financed transfers to domestic households—-the real-life equivalent of that hoary thought experiment, the “helicopter drop” of newly printed money. I think most economists would agree that a large enough helicopter drop must raise the price level.And relevant to the FOMC meeting tomorrow:
A nonstandard open-market operation ... is the purchase of some asset by the central bank (long-term government bonds, for example) at fair market value. The object of such purchases would be to raise asset prices, which in turn would stimulate spending (for example, by raising collateral values). I think there is little doubt that such operations, if aggressively pursued, would indeed have the desired effect ...
Incoming data give the Fed a green light to ease further. There is frequent chatter from unnamed sources that the Fed can do more and will consider more at this Tuesday's FOMC meeting. The public stance of Fed officials is recent weeks has tended to downplay the necessity for action at this juncture. This combination leaves the outcome of this week's FOMC meeting in doubt. My baseline expectation is that the FOMC statement acknowledges the weakness in recent data, but leaves the current policy stance intact. There is a nontrivial possibility that the Fed either implicitly or explicitly ends the policy of passive balance sheet contraction. I believe it very unlikely that the Fed sets in motion an expansion of the balance sheet.There is much more in Duy's piece.
Fannie, Freddie, FHA REO Inventory Increases 13% in Q2 from Q1 2010
by Calculated Risk on 8/09/2010 11:25:00 AM
The combined REO (Real Estate Owned) inventory for Fannie, Freddie and the FHA increased by 13% in Q2 2010 from Q1 2010. The REO inventory (lender Real Estate Owned) increased 74% compared to Q2 2009 (year-over-year comparison). Click on graph for larger image in new window.
This graph shows the REO inventory for Fannie, Freddie and FHA through Q2 2010.
The REO inventory for the "Fs" has increased sharply over the last year, from 135,868 at the end of Q2 2009 to 236,338 at the end of Q2 2010.
This is a new record for Fannie and Freddie; the FHA's REO inventory decreased slightly in Q2 2010.
Remember this is just a portion of the total REO inventory. Private label securities and banks and thrifts also hold a substantial number of REOs.
Freddie Mac: $4.7 billion Loss, REO Inventory increases 79% YoY
by Calculated Risk on 8/09/2010 09:40:00 AM
Freddie Mac reported: "a net loss of $4.7 billion for the quarter ended June 30, 2010, compared to a net loss of $6.7 billion for the quarter ended March 31, 2010." and the FHFA requested another $1.8 billion from Treasury. (ht jb)
"We recognize that high unemployment and other factors still pose very real challenges for the housing market" said Freddie Mac Chief Executive Officer Charles E. Haldeman, Jr. Click on graph for larger image in new window.
Freddie Mac reported that their REO inventory increased 79% year over year, from 34,699 in Q2 2009 to 62,178 in Q2 2010.
REO: Real Estate Owned.
See page 16 of the Second Quarter 2010 Financial Results Supplement
This graph shows the rapid increase in REO.
Note: last week I posted a graph of the Fannie Mae REO.
East of San Francisco: 20% Unemployment, House Prices off Sharply
by Calculated Risk on 8/09/2010 08:49:00 AM
Alana Semuels at the LA Times describes the impact of the housing / credit bust on the communities east of San Francisco: Northeast of Silicon Valley, recession's effects are magnified. A few excerpts:
[B]uilding has all but stopped. Home prices in San Joaquin County have fallen 63% since the peak median price of $451,500 in November 2005, according to MDA DataQuick. [Note: these are median prices]. Prices in Contra Costa County are down 53% from their peak of $600,000 in April 2007. One in every 135 houses in Contra Costa County received a foreclosure filing in June 2010. In San Joaquin County, that figure is 1 in 104 — nearly double the California average.During the boom, a large percentage of the people in these communities worked in construction or other real estate related fields - and for obvious reasons, the more an area was dependent on housing, the larger the negative impact of the housing bust.
Signs of a slowdown are everywhere. At Bethel Island, a Contra Costa County summer vacation area normally busy with tourists and fishermen, boats sit rotting in the Sacramento River. Nearby, a planned residential waterfront development has stalled. The builder completed boat docks before pulling out; an eerie remnant of the luxury once planned there. In Livermore, an Alameda County town, whole shopping developments are empty and foreclosure notices dot homes.
...
The unemployment rate in Stockton, the county seat of San Joaquin County, is 19.8%. It's 29% in the nearby hamlet of Garden Acres, higher than any city of its size in Southern California's Inland Empire.


