 RSS Feed
 by Calculated Risk on 7/06/2010 12:37:00 PM
Tuesday, July 06, 2010
Older, more educated workers, have highest length of unemployment
Reader Ann (retired lawyer with economics degree) has obtained some publicly available raw data on the long term unemployed from the BLS Current Population Survey. Ann was able to break down the long term unemployed into two age cohorts, 1) 25 to 45, and 2) 45+.
She also broke down the data by four levels of education: 1) no high school degree, 2) high school only, 3) some college or Associates degree, and 4) BA degree or higher.
The following table summarizes the data (click on link to see table - it doesn't fit here):
Table Long Term Unemployed
(1) This includes all who have some college classes but no degree or certificate, those with certificates and those with an associates. Only 30%+/- of the “some college” group has an associates. There is not statistically significant difference in their average length of unemployment as between the ‘few classes’ or ‘certificate’ and an associates..
(2) I do not have the breakdown of all the unemployed by age combined with education. I only have that data for the long-term unemployed.
The first finding is not too surprising for the longer term unemployed:
The 2nd finding is a more surprising:
For the long term unemployed, it is better to be younger - and have less education.
Ann adds these comments:
More education = longer unemployment if the job is lost. The upside is the more educated the worker, the less likely they are to lose their job, but the downside of being more educated is that once they hit 45 if they lose their job, they are toast.It is tough to find a job, especially if you are older and better educated.
So what does one do with the over-45s with a BA or higher? ... The current mantra is 'more education is good for you' but this shows that it can, in the long run, hurt you.
ISM Non-Manufacturing Index shows slower expansion in June
by Calculated Risk on 7/06/2010 10:00:00 AM
The June ISM Non-manufacturing index was at 53.8%, down from 55.4% in May - and below expectations of 55. The employment index showed contraction in June at 49.7%. Click on graph for larger image in new window.
This graph shows the ISM non-manufacturing index (started in January 2008) and the ISM non-manufacturing employment diffusion index.
The employment index is showing contraction again after one month of expansion.
From the Institute for Supply Management: June 2010 Non-Manufacturing ISM Report On Business®
Economic activity in the non-manufacturing sector grew in June for the sixth consecutive month, say the nation's purchasing and supply executives in the latest Non-Manufacturing ISM Report On Business®.
The report was issued today by Anthony Nieves, C.P.M., CFPM, chair of the Institute for Supply Management™ Non-Manufacturing Business Survey Committee; and senior vice president — supply management for Hilton Worldwide. "The NMI (Non-Manufacturing Index) registered 53.8 percent in June, 1.6 percentage points lower than the 55.4 percent registered in May, indicating continued growth in the non-manufacturing sector, but at a slightly slower rate. The Non-Manufacturing Business Activity Index decreased 3 percentage points to 58.1 percent, reflecting growth for the seventh consecutive month. The New Orders Index decreased 2.7 percentage points to 54.4 percent, and the Employment Index decreased 0.7 percentage point to 49.7 percent, reflecting contraction after one month of growth. The Prices Index decreased 6.8 percentage points to 53.8 percent in June, indicating that prices are still increasing but at a slower rate than in May. According to the NMI, 15 non-manufacturing industries reported growth in June. Respondents' comments are mostly positive about business conditions; however, there is concern about the effect of employment on the economic recovery."
emphasis added
Reis: U.S. Office Vacancy Rate at 17 year high
by Calculated Risk on 7/06/2010 08:23:00 AM
 Click on graph for larger image in new window.
This graph shows the office vacancy rate starting 1991.
Reis is reporting the vacancy rate rose to 17.4% in Q1 2010, up from a revised 17.3% in Q1 (revised up from 17.2%), and up from 16.0% in Q2 2009. The peak following the previous recession was 16.9%.
From Bloomberg Office Vacancy Rate in U.S. Climbs to 17-Year High, Reis Says
The vacancy rate climbed to 17.4 percent from 16 percent a year earlier and 17.3 percent in the first quarter, the New York-based research company said today in a statement. Effective rents, the amount tenants actually pay landlords, fell 5.7 percent from a year earlier and 0.9 percent from the previous three months, according to Reis.It appears the rate of increases has slowed.
Reis should release the Mall and Apartment vacancy rates over the next few days, and those will probably be at record levels.
Monday, July 05, 2010
Rogoff sees "Collapse" in China's Property Market
by Calculated Risk on 7/05/2010 08:29:00 PM
From Bloomberg: China Property Market Beginning Collapse That May Hit Banks, Rogoff Says (ht jb)
“You’re starting to see that collapse in property and it’s going to hit the banking system,” [Kenneth Rogoff, Harvard University professor and former chief economist of the IMF] said today [in an interview with Bloomberg Television in Hong Kong].It appears Rogoff is talking about a "collapse" in sales, but price frequently follows volume in real estate - so perhaps he is also talking about a steep decline in prices.
...
He also said that while recoveries across the global economy are “very slow,” the danger of a return to recession isn’t “elevated.”
Note: Here is the weekly summary and a look ahead (with plenty of graphs from last week).
The Nikkei is off about 1.5% in early trading.
And from CNBC: Pre-Market Data shows the S&P 500 off over 1% (close to breaking under 1000) and Dow futures are off about 110 points.
Best to all.
More on the slowdown in China
by Calculated Risk on 7/05/2010 03:58:00 PM
Just a follow up to the previous posts on oil prices and the 2nd half slowdown ...
From Bloomberg: China Car Sales Grow at Slower Pace; Services Index Slides to 15-Month Low (ht Paulo)
China’s auto sales grew at a slower pace in June and a services-industry index slid to a 15-month low, adding to signs that the economy leading the world recovery is cooling.Slowing in China is just one of the 2nd half stories - there is also less stimulus spending, state and local government cutbacks, more household saving impacting consumption, another downturn in housing, and a slowdown and financial issues in Europe.
Passenger-car purchases rose 10.9 percent from a year earlier, down from May’s 25 percent gain, the China Automotive Technology & Research Center said today. The services-industry measure fell to 55.6 from 56.4, HSBC Holdings Plc and Markit Economics said in an e-mailed statement.
On the flip side, Yahoo had a headline this morning: 8 Problems That Could Trigger a Double-Dip Recession (ht Brian). Brian joked that this might be a new contrary indicator (like the old magazine cover indicator).
Update on Oil Prices
by Calculated Risk on 7/05/2010 01:21:00 PM
With the weakness in the US and European economies, and an apparent slowdown in China, it might be time to look at oil prices ...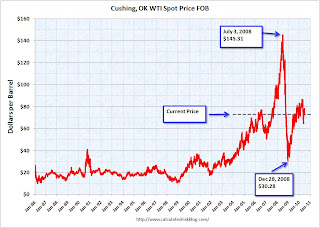 Click on graph for larger image in new window.
These are spot prices for Cushing WTI from the EIA (source).
Back in the Spring of 2008, we started seeing many signs of potential demand destruction - including fewer U.S miles driven, Asian countries reducing gasoline subsidies, and China stock piling oil for the Olympics. That was a pretty clear sign that oil prices would fall after China stopped stock piling oil.
So far miles driven have been increasing slowly (although the most recent data is for April, and there may be more weakness in June). And once again the Shanghai stock market is suggesting a slowdown in China. Not a clear sign like in 2008, but something to watch.
Europe: Austerity or "rigorous fiscal policies"?
by Calculated Risk on 7/05/2010 08:57:00 AM
A couple of quotes from the WSJ: Lagarde: Banks Will Pass Stress Tests
"There is no choice between austerity and stimulus," [Finance Minister Christine Lagarde] said at an economic conference in Aix-en-Provence. "Our policy is a subtle mix between growth-friendly spending cuts and letting play out the remainder of our stimulus package," she said.Paul Krugman disagrees: Plan XVII For Europe
...
"We are in a period when we have to manage budgets very cautiously. ... You may call that austerity if you want, I call this rigorous fiscal policies," [European Central Bank President Jean-Claude Trichet] told reporters on the sidelines of an economic conference in southern France.
"If you want sustainable growth, then you have to restore confidence and to do that you need to have balanced and sustainable fiscal policies in place," he added
Sunday, July 04, 2010
Happy July 4th
by Calculated Risk on 7/04/2010 11:02:00 PM
Two earlier posts:
The National Mall in D.C. July 4th, 2010. Best to all!
Investors buying foreclosures in Phoenix
by Calculated Risk on 7/04/2010 05:22:00 PM
Here is an article from the AP about investors buying foreclosures in the Phoenix area: Finding gold in them thar foreclosures (ht Ian).
I can add a little to this story: I know of an individual investor (through a close friend) in the Phoenix area who has bought almost 100 homes over the last 18 months. The investor has shared with me his portfolio. He has only bought single family homes, no condos. His average purchase price was under $35,000 and most of the homes are 3 br / 2 ba.
He is renting the homes, many by the room. Yeah, they sound like flophouses! The investor is starting to have a vacancy problem that he attributes to the new Arizona immigration law that takes effect on July 29th.
I reviewed the public records of some of the homes this investor bought - as an example he bought a 3 br / 2 ba 1,200 sq ft home for about $35,000 a couple of months ago - and that is about the average for the homes he has been buying. Very basic, dirt yards ... not the best area.
He paid in the low $20,000s for a home he bought last summer that sold for over $180,000 in 2006! That is almost 90% off the peak price (the house sold for $62,000 in 2004, so I'm guessing fraud in 2006 - and maybe in 2004 too).
Note: all numbers changed a little - the investor wants to remain anonymous.
Weekly Summary and a Look Ahead
by Calculated Risk on 7/04/2010 11:45:00 AM
This will be a light week for US economic data. The US stock markets will be closed on Monday to observe Independence Day.
Sometime this week, Reis will release the Q2 mall, office and apartment vacancy rates. In Q1, Reis reported the strip mall vacancy rate hit 10.8% (highest since 1991), the apartment vacancy rate was at a record 8% (large cities only), and the office vacancy rate rose to rose to 17.2% (highest since the early '90s).
On Tuesday, the June ISM non-manufacturing report will be released. Consensus is for a decrease to 55.0 from 55.4 in the service sector.
On Wednesday, the MBA will release the mortgage purchase applications index. This has been falling sharply after the expiration of the home buyer tax credit. Also on Wednesday, Minneapolis Fed President Narayan Kocherlakota will speak at the Université de Montréal at 3:30 PM ET (Society for Economic Dynamics).
On Thursday, the initial weekly unemployment claims will be released. Consensus is for a decline to 465K from 472K last week. Also on Thursday, the Fed will release Consumer Credit for May at 3 PM ET. Consumer credit has declined sharply since mid-2008, especially revolving debt (credit cards).
Also on Thursday, at 6 PM ET, Professor Robert Hall, the current Chairman of NBER, will speak at the Society for Economic Dynamics: “Reconsidering the Basic Tenets of Macroeconomics in the Light of the Past Two Years”. He might be asked about the possibility of a “double dip” recession.
On Friday the Census Bureau will release Wholesale Inventories for May, and the FDIC will probably get back to work ...
A couple of posts on the 2nd half:
And a summary of last week:
1) Total nonfarm payroll employment declined by 125,000 in June
2) Census 2010 hiring decreased 225,000 in June.
3) So non-farm payroll employment increased 100,000 in June ex-Census. Private-sector payroll employment increased by 83,000.
4) The unemployment rate declined down to 9.5 percent as the participation rate fell (workers leaving the workforce pushed down the unemployment rate).
5) Average hourly wages and average hours worked decreased.
Overall this was a weak report. Here are a few graphs ...
Percent Job Losses During Recessions, aligned at Bottom
 Click on graph for larger image.
This graph shows the job losses from the start of the employment recession, in percentage terms - aligned at the bottom of the recession.
The dotted line shows the impact of Census hiring. In June, there were 339,000 temporary 2010 Census workers on the payroll. The number of Census workers will continue to decline - and the gap between the solid and dashed red lines will be mostly closed in three or four months.
Employment-Population Ratio
The Employment-Population ratio decreased to 58.5% in June from 58.7% in May. This had been increasing after plunging since the start of the recession, and the recovery in the Employment-Population ratio was considered a good sign - but the ratio has now decreased for two consecutive months.
 This graph shows the employment-population ratio; this is the ratio of employed Americans to the adult population.
Note: the graph doesn't start at zero to better show the change.
Also the Labor Force Participation Rate decreased to 64.7% in June from 65.0% in May. This is the percentage of the working age population in the labor force. This decline is very disappointing, and the rate is well below the 66% to 67% rate that was normal over the last 20 years.
The reason the unemployment rate declined was because people left the workforce - and that is not good news. As the employment picture improves, people will return to the labor force, and that will put upward pressure on the unemployment rate.
Part Time for Economic Reasons
 The number of workers only able to find part time jobs (or have had their hours cut for economic reasons) was at 8.63 million in June. This was a slight decline from May - and was a little bit of good news.
The all time record of 9.24 million was set in October.
These workers are included in the alternate measure of labor underutilization (U-6) that was at 16.5% in June.
Unemployed over 26 Weeks
 The blue line is the number of workers unemployed for 27 weeks or more. The red line is the same data as a percent of the civilian workforce.
According to the BLS, there are 6.751 million workers who have been unemployed for more than 26 weeks and still want a job. This is a record 4.39% of the civilian workforce. (note: records started in 1948). It does appear the increases are slowing ...
 Based on an estimate from Autodata Corp, light vehicle sales were at a 11.08 million SAAR in June. That is up 14% from June 2009 (when sales were very low), and down 4.6% from the May sales rate.
This graph shows the historical light vehicle sales (seasonally adjusted annual rate) from the BEA (blue) and an estimate for June (red, light vehicle sales of 11.08 million SAAR from Autodata Corp).
This was below most forecasts of around 11.4 million SAAR.
S&P/Case-Shiller released the monthly Home Price Indices for April (actually a 3 month average).
 This graph shows the nominal not seasonally adjusted Composite 10 and Composite 20 indices (the Composite 20 was started in January 2000).
The Composite 10 index is off 29.7% from the peak, and up 0.3% in April (SA).
The Composite 20 index is off 29.0% from the peak, and up 0.4% in April (SA).
The next graph shows the price declines from the peak for each city included in S&P/Case-Shiller indices.
 Prices increased (SA) in 17 of the 20 Case-Shiller cities in April (SA).
 Prices in Las Vegas are off 55.9% from the peak, and prices in Dallas only off 5.2% from the peak.
Case Shiller is reporting on the NSA data (18 cities up), and I'm using the SA data. As S&P noted, there probably was a small boost to prices from tax credit related buying, but prices will probably fall later this year.
From the BEA: Personal Income and Outlays, April 2010
The following graph shows real Personal Consumption Expenditures (PCE) through May (2005 dollars). Note that the y-axis doesn't start at zero to better show the change.
 The quarterly change in PCE is based on the change from the average in one quarter, compared to the average of the preceding quarter.
Even with no growth in June, PCE growth in Q2 would be 2.5%. Even with the weak June data, it looks like my earlier estimate of 3% PCE growth in Q2 will be about right (maybe a little high).
Best wishes to all.


