 RSS Feed
 by Calculated Risk on 6/30/2010 09:55:00 PM
Wednesday, June 30, 2010
Fannie Mae: Serious Delinquency rate declines in April
 Click on graph for larger image in new window.
Fannie Mae reported today that the rate of serious delinquencies - at least 90 days behind - for conventional loans in its single-family guarantee business decreased to 5.30% in April, down from 5.47% in March - and up from 3.42% in April 2009.
"Includes seriously delinquent conventional single-family loans as a percent of the total number of conventional single-family loans."
This is similar to the report from Freddie Mac (although Fannie Mae releases data one month later). Just as for Freddie Mac, some of the earlier rapid increase was probably because of foreclosure moratoriums, and distortions from modification programs because loans in trial mods were considered delinquent until the modifications were made permanent.
More modifications have become permanent (and no longer counted as delinquent) and Fannie Mae is foreclosing again (they have a record number of REOs) - so there has been a slight decline in the delinquency rate.
Lawler: Residential Listings in June
by Calculated Risk on 6/30/2010 05:47:00 PM
CR Note: How the NAR calculates existing home inventory is a bit of a mystery. Housing economist Tom Lawler has been tracking inventory several different ways. The following post is from Tom Lawler:
This morning there were 3,973,439 residential listings on realtor.com, up 1.6% from late May and up 0.3% from a year ago. Listings in California, which declined sharply during 2009, were up 2.3% on the month and up 7.4% from a year ago. States with especially large monthly increases in listings including Washington (14.5%, after an 8.4% drop in May – Washington data are whacky!), Alaska (5.1%), Maine (4.9%), and Colorado (4.3%). Florida listings were up 0.3% on the month but down 9.5% from a year ago. Click on graph for larger image in new window.
I’m not sure how often realtor.com listings by states are “refreshed,” or whether the updates are identical across states. However, the realtor.com data appear to “synch up” better to reports from various MLS than do the monthly National Association of Realtor data – which often displays monthly swings completely out of whack with the various “inventory trackers” that I and others follow. The NAR wasn’t willing to give me details of its methodology, but it apparently uses the sample data from various realtor associations/boards/MLS, and it may estimate the national totals with gross-ups based on “months’ supply.” Whatever the case, the monthly NAR numbers appear to have “spurious volatility” unrelated to actual swings in listings.
CR Note: This seems to suggest an increase in inventory in June. Using Realtor.com isn't perfect, but it is a consistent and transparent method.
Market Update
by Calculated Risk on 6/30/2010 04:06:00 PM
The end of Q2 ...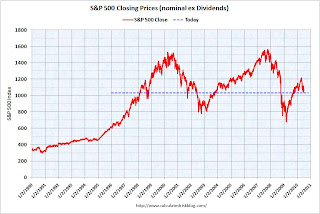 Click on graph for larger image in new window.
The first graph shows the S&P 500 since 1990 (this excludes dividends).
The dashed line is the closing price today. The S&P 500 was first at this level in February 1998; over 12 years ago. 
Click on graph for interactive version in new window.
The graph has tabs to look at the different bear markets - "now" shows the current market - and there is also a tab for the "four bears".
Fed's Lockhart: Sustainable final demand not yet supporting growth
by Calculated Risk on 6/30/2010 01:39:00 PM
From Atlanta Fed President Dennis Lockhart: Recovery and the Challenge of Uncertainty
The central question is whether the recovery that is now well under way will be sustained or will falter, resulting in a slowdown or even a second recession—the so-called double dip.
...
Rising consumer activity surprised many in the first quarter of the year, but in April and May consumers seemed to put away their wallets to a certain extent. ... Business spending on equipment and software has been strong in the first half of the year. ... Manufacturing production is up about 8 percent over the past year through May.
...
Here's a key point about these contributors to recovery—each could be transitory. The economy has not yet arrived at a state where healthy and sustainable final demand is underpinning growth.
... I believe the recovery will move ahead at a modest pace and unemployment will gradually come down. Impediments to growth are being removed. Financial market function is being restored. Private balance sheets are being repaired. And necessary structural adjustments are under way.
The past few weeks, however, have seen a slight retrenchment from the mind-set of optimism and growing confidence that prevailed earlier in the year.
...
Several recent sources of uncertainty have clouded the outlook. I will cite four, including the oil spill in the Gulf.
First is European sovereign debt. ... Our financial system here in the United States has rather small and manageable direct exposure to the Greek government and the other sovereign borrowers. But as the situation has evolved, exposure to European banks as well as foreign and local corporations in the affected countries has complicated the estimation of risk.
...
A second source of uncertainty is ongoing state and local fiscal tightening.
...
A third area of uncertainty is commercial real estate. Banks across the country, especially small and regional banks, are heavily exposed to the commercial property sector and face a heavy docket of loan restructurings that may require sizable write-downs.
...
And there is the oil spill, which is, naturally, the central environmental and economic concern here in Louisiana and more broadly in the Gulf region. ...
The economic effect at the national level has been limited. I'm prepared to believe, however, that this relentless environmental disaster is an additional factor holding back consumer and business confidence. The spill disheartens us all and, I believe, makes the public a little more reticent to assume a smooth recovery path.
...
So, to pull this together, a recovery of the national economy is proceeding but not yet with solid and sustainable underpinnings. Inflation appears restrained. The outlook from here is beset by somewhat more than normal uncertainty.
Restaurant Index "Softened" in May
by Calculated Risk on 6/30/2010 11:57:00 AM
This is one of several industry specific indexes I track each month.  Click on graph for larger image in new window.
For the second consecutive month, same store sales and customer traffic both declined in May (year-over-year).
This has taken a toll on the positive outlook in the "expectations index" and the overall index showed contraction in May.
Unfortunately the data for this index only goes back to 2002.
Note: Any reading above 100 shows expansion for this index.
From the National Restaurant Association (NRA): Restaurant Industry Outlook Softened in May as Restaurant Performance Index Fell Below 100
The outlook for the restaurant industry softened in May, as the National Restaurant Association’s comprehensive index of restaurant activity fell below 100 for the first time in three months. The Association’s Restaurant Performance Index (RPI) – a monthly composite index that tracks the health of and outlook for the U.S. restaurant industry – stood at 99.7 in May, down 0.7 percent from April’s level of 100.4.Restaurants are a discretionary expense, and they tend to be 'first in, last out' of a recession for consumer spending (as opposed to housing that is usually first in and first out). Since restaurants both lead and lag recessions, this contraction could be because of the sluggish recovery or might suggest further weakness in consumer spending in the months ahead.
...
Restaurant operators reported a net decline in same-store sales for the second consecutive month in May.
...
Restaurant operators also reported softer customer traffic results in May.
...
Although sales and traffic results softened in May, restaurant operators reported an uptick in capital spending activity.
...
Although restaurant operators remain optimistic about sales growth in the months ahead, their optimism slipped somewhat in recent months.
emphasis added
Chicago PMI shows expansion in June
by Calculated Risk on 6/30/2010 09:45:00 AM
From the Institute for Supply Management – Chicago:
The Chicago Purchasing Managers reported the CHICAGO BUSINESS BAROMETER indicated the breadth of expansion showed little change, and chalked up a ninth month of growth.The overall index declined to 59.1 from 59.7 (just below expectations). Note: any number above 50 shows expansion.
Employment improved to 54.2 after showing a decline (below 50) in May.
The new orders index declined again to 59.1 from 62.7. This is the lowest level this year.
The national ISM manufacturing index will be released tomorrow.
ADP: Private Employment increased 13,000 in June
by Calculated Risk on 6/30/2010 08:15:00 AM
ADP reports:
Nonfarm private employment increased 13,000 from May to June 2010 on a seasonally adjusted basis, according to the ADP National Employment Report®. The estimated change in employment from April to May 2010 was revised up slightly, from the previously reported increase of 55,000 to an increase of 57,000.Note: ADP is private nonfarm employment only (no government jobs).
June’s rise in private employment was the fifth consecutive monthly gain. However, over these five months the increases have averaged a modest 34,000. Recent ADP Report data suggest that, following steady improvement through April, private employment may have decelerated heading into the summer.
This is below the consensus forecast of ADP showing an increase of 60,000 private sector jobs in June.
The BLS reports on Friday, and the consensus is for a decrease of 100,000 payroll jobs in June, on a seasonally adjusted (SA) basis, with the loss of around 250,000 temporary Census 2010 jobs (+150,000 ex-Census).
MBA: Mortgage Refinance Applications increase, Purchase Applications near 13 Year Low
by Calculated Risk on 6/30/2010 07:18:00 AM
The MBA reports: Mortgage Refinance Applications Increase as Rates Continue to Drop in Latest MBA Weekly Survey
The Refinance Index increased 12.6 percent from the previous week and is the highest Refinance Index observed in the survey since the week ending May 22, 2009. The seasonally adjusted Purchase Index decreased 3.3 percent from one week earlier.
...
“Amid continuing financial market volatility, mortgage rates dropped again last week, with rates on 15-year loans reaching a record low for the MBA survey. Refinance applications jumped in response, but remain at about half the level seen in the spring of 2009,” said Michael Fratantoni, MBA’s Vice President of Research and Economics. “Purchase applications declined for the seventh time in the last eight weeks, keeping the purchase index near 13-year lows.”
...
The average contract interest rate for 30-year fixed-rate mortgages decreased to 4.67 percent from 4.75 percent, with points decreasing to 0.96 from 1.07 (including the origination fee) for 80 percent loan-to-value (LTV) ratio loans. This is the lowest 30-year contract rate recorded in the survey since the week ending April 24, 2009.
 Click on graph for larger image in new window.
This graph shows the MBA Purchase Index and four week moving average since 1990.
The purchase index has collapsed following the expiration of the tax credit suggesting home sales will fall sharply too. This is the lowest level for 4-week average of the purchase index since 1996.
Tuesday, June 29, 2010
Shanghai Composite at lowest level since April 2009
by Calculated Risk on 6/29/2010 10:57:00 PM
Just an update ... Click on graph for larger image in new window.
This graph shows the Shanghai SSE Composite Index and the S&P 500 (in blue).
The SSE Composite Index is at 2,384 - down almost 2% and off almost 25% since early April.
This is the lowest level since April 2009.
House Passes Homebuyer Tax Credit Closing Extension
by Calculated Risk on 6/29/2010 07:03:00 PM
From Reuters: U.S. House backs homebuyer tax credit extension
This is bad policy ... and the Senate will probably pass it tomorrow.


