 RSS Feed
 by Calculated Risk on 5/05/2010 10:13:00 PM
Wednesday, May 05, 2010
Evening Euro
Just a bit of an overview ... the European Central Bank (ECB) is meeting in Lisbon, Portugal, and will announce their interest rate decision at 4:45 AM ET. You can watch the news conference here live at 5:30 AM ET.
Great timing to meet in Lisbon since earlier today Moody's warned that Portugal may face a downgrade.
Ratings agency Moody's Investors Service on Wednesday placed Portugal's government bond ratings on review for possible downgrade, citing the recent deterioration of the country's public finances and "long-term growth challenges" to the economy.Three months?
In the event of a downgrade, the country's Aa2 ratings would fall by one or, at most, two notches, the agency said. Moody's said it expects to complete the review within three months.
At the meeting, it is expected that the ECB will leave rates unchanged at 1%.
Professor Krugman argues Greece may end up leaving the euro: Greek End Game
Many commentators now believe that Greece will end up restructuring its debt — a euphemism for partial repudiation. I agree. But the reasoning seems to stop there, which is wrong. In effect, the consensus that Greece will end up defaulting is probably too optimistic. I’m growing increasingly convinced that Greece will end up leaving the euro, too.And there was sad news from Greece, from Reuters: Europe leaders warn of contagion, 3 die in Greece
Freddie Mac: Q1 Net Loss $6.7 billion, Asks for $10.6 billion
by Calculated Risk on 5/05/2010 05:40:00 PM
"[A]s we have noted for many months now, housing in America remains fragile with historically high delinquency and foreclosure levels, and high unemployment among the key risks."
Freddie Mac Chief Executive Officer Charles E. Haldeman, Jr.
Press Release: Freddie Mac Reports First Quarter 2010 Financial Results
First quarter 2010 net loss was $6.7 billion. ...The first quarter loss in 2009 was $9.97 billion and the Q4 2009 loss was $6.5 billion. The losses keep coming, but last quarter Haldeman warned about "a potential large wave of foreclosures", so it appears he is a little more optimistic.
Net worth deficit was $10.5 billion at March 31, 2010, driven primarily by a significant adverse impact due to the change in accounting principles. ...
The Federal Housing Finance Agency (FHFA), as Conservator, will submit a request on the company’s behalf to Treasury for a draw of $10.6 billion under the Senior Preferred Stock Purchase Agreement (Purchase Agreement).
emphasis added
Whitney: Banks Under-reserved for 'Double-dip' in House Prices
by Calculated Risk on 5/05/2010 02:25:00 PM
From Nikolaj Gammeltoft and Peter Eichenbaum at Bloomberg: Whitney Says Banks Face ‘Tough’ Quarter, Housing Dip (ht jb)
Banks continue to suffer from losses on non-performing loans, and U.S. home prices will fall again amid increasing supply and sluggish demand, according to [banking analyst Meredith Whitney].I also think the repeat national house price indexes (Case-Shiller, LoanPerformance) will show further price declines later this year. But, we have to recognize that a majority of the national price declines are behind us, and any 'double-dip' in prices will be much smaller than the previous declines.
“I’m steadfast in my belief there’s going to be a double- dip in housing,” she said. “You will see clearly that the banks are under-reserved when housing dips again.”
My guess is some mid-to-high end bubble areas will see the largest future price declines - so the impact on the banks will depend on their exposure to the those areas.
I think BofA with the Countrywide loans, Wells Fargo with Wachovia / Golden West, and JPMorgan with WaMu are all exposed to the mid-to-high end bubble areas. But all the acquiring banks took large write-downs for these loans earlier, so I'm not sure Whitney is correct about them being under-reserved (it is hard to tell). Of course there are the 2nd lien issues too.
Web Resources for tracking the Oil Spill
by Calculated Risk on 5/05/2010 12:19:00 PM
 A couple of resources ...
From NOAA: Deepwater Horizon Incident, Gulf of Mexico
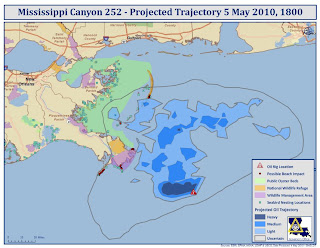
From the Office of the Governor, Louisiana: Gulf Oil Spill 2010 Trajectory
Click on map for larger image in new window.
Update: from Google: Gulf of Mexico Oil Spill (ht Jan)
ISM Non-Manufacturing Index Shows Expansion
by Calculated Risk on 5/05/2010 10:02:00 AM
April ISM Non-Manufacturing index 55.4%, unchanged from March.
This shows further growth in the service sector, although employment contracted for the 28th consecutive month.
From the Institute for Supply Management: April 2010 Non-Manufacturing ISM Report On Business®
Economic activity in the non-manufacturing sector grew in April for the fourth consecutive month, say the nation's purchasing and supply executives in the latest Non-Manufacturing ISM Report On Business®.
The report was issued today by Anthony Nieves, C.P.M., CFPM, chair of the Institute for Supply Management™ Non-Manufacturing Business Survey Committee; and senior vice president — supply management for Hilton Worldwide. "The NMI (Non-Manufacturing Index) registered 55.4 percent in April, the same percentage as registered in March, and indicating growth in the non-manufacturing sector. The Non-Manufacturing Business Activity Index increased 0.3 percentage point to 60.3 percent, reflecting growth for the fifth consecutive month. The New Orders Index decreased 4.1 percentage points to 58.2 percent, and the Employment Index decreased 0.3 percentage point to 49.5 percent."
...
Employment activity in the non-manufacturing sector contracted in April for the 28th consecutive month. ISM's Non-Manufacturing Employment Index for April registered 49.5 percent. This reflects a decrease of 0.3 percentage point when compared to the 49.8 percent registered in March.
emphasis added
ADP: Private Employment increased in April
by Calculated Risk on 5/05/2010 08:15:00 AM
ADP reports:
Nonfarm private employment increased 32,000 from March to April 2010 on a seasonally adjusted basis, according to the ADP National Employment Report. The estimated change in employment from February to March 2010 was revised up, from a decline of 23,000 to an increase of 19,000.Note: ADP is private nonfarm employment only (no government jobs).
In addition, the revised estimate of the monthly change in employment from January to February 2010 shows a modest increase of 3,000. Thus, employment has increased for three straight months, albeit only modestly. The slow pace of improvement from February through April is consistent with the pause in the decline of initial unemployment claims that occurred during the winter months.
...
April’s ADP Report estimates nonfarm private employment in the service-providing sector rose by 50,000, the third consecutive monthly increase. Employment in the goods-producing sector declined 18,000 during April. However, while construction employment dropped 49,000, manufacturing employment, in an encouraging sign, rose 29,000, the third consecutive monthly increase.
This is close to the consensus forecast of an increase of 28,000 private sector jobs in April.
The BLS reports on Friday, and the consensus is for an increase of 200,000 payroll jobs in April, on a seasonally adjusted (SA) basis, with about 100,000 temporary Census 2010 jobs.
MBA: Mortgage Purchase Applications Highest Since October
by Calculated Risk on 5/05/2010 07:00:00 AM
The MBA reports: Purchase Applications Continue to Increase, Refinance Activity Declines in Latest MBA Weekly Survey
The Market Composite Index, a measure of mortgage loan application volume, increased 4.0 percent on a seasonally adjusted basis from one week earlier. ...
The Refinance Index decreased 2.1 percent from the previous week and the seasonally adjusted Purchase Index increased 13.0 percent from one week earlier. This is the third consecutive weekly increase in purchase applications and the highest Purchase Index recorded in the survey since the week ending October 2, 2009. ...
"Purchase application activity continued to increase in the last week of the homebuyer tax credit program," said Michael Fratantoni, MBA's Vice President of Research and Economics. "Purchase applications were up 13 percent over the previous week and almost 24 percent over the last month, driven by significant increases in both conventional and government purchase applications. We also saw the Government share of applications for purchasing a home increase to over 50 percent of all purchase applications last week, which is the highest in two decades."
... The average contract interest rate for 30-year fixed-rate mortgages decreased to 5.02 percent from 5.08 percent, with points increasing to 0.92 from 0.91 (including the origination fee) for 80 percent loan-to-value (LTV) ratio loans.
 Click on graph for larger image in new window.
This graph shows the MBA Purchase Index and four week moving average since 1990.
This is the highest level for the purchase index since last October. The index will probably turn down in the next week or two since the tax credit expired last Friday (buyers need to close by June 30th).
Tuesday, May 04, 2010
Martin Wolf: A bail-out for Greece is just the beginning
by Calculated Risk on 5/04/2010 07:47:00 PM
Martin Wolf writes in the Financial Times: A bail-out for Greece is just the beginning
Wolf reviews the bailout of Greece, and points out that Greece will probably be in prolonged slump. He wonders if the Greeks will "bear that burden year after weary year?"
And on the other members of the eurozone:
[T]he programme prevents an immediate shock to fragile financial systems: it is overtly a rescue of Greece, but covertly a bail-out of banks. But it is far from clear that it will help other members now in the firing line. ... Other eurozone members might well end up on their own. None is in as bad a condition as Greece ... But several have unsustainable fiscal deficits and rapidly rising debt ratios.Wolf is not optimistic and has "huge doubts".
excerpts with permission
The 2nd Half Slowdown
by Calculated Risk on 5/04/2010 04:50:00 PM
There are several analysts forecasting GDP growth to pick up in the 2nd half of this year, with annual GDP growth of over 4% for 2010 (the advance Q1 GDP estimate was 3.2%, so over 4% for 2010 would require a nice pick up in the 2nd half). This is not a "v-shaped" recovery - that didn't happen - but these forecasts are still above trend growth.
Unfortunately I think we will see a slowdown in the 2nd half of the year, but still positive growth. Last year I argued for a 2nd half recovery ... and that was more fun!
Here are a few reasons I think the U.S. economy will slow:
1) The stimulus spending peaks in Q2, and then declines in the 2nd half of 2010. This will be a drag on GDP growth in the 2nd half of this year.
2) The inventory correction that added 3.8% to GDP in Q4, and 1.6% to GDP in Q1, has mostly run its course.
3) The growth in Personal Consumption Expenditures (PCE) in Q1 came mostly from less saving and transfer payments, as opposed to income growth. That is not sustainable, and future growth in PCE requires jobs and income growth. Although I expect employment to increase, I think the job market will recover slowly (excluding temporary Census hiring) because the key engine for job growth in a recovery is residential investment (RI) - and RI has stalled (until the excess housing inventory is reduced).
4) There is a slowdown in China and Europe has some problems (if no one noticed) ... and that will probably impact export growth, and also negatively impact one of the strongest U.S. sectors - manufacturing (when was the last time manufacturing was one of the strongest sectors?)
Of course monetary policy is still supportive and it is unlikely the Fed will sell assets or raise the Fed Funds rate this year. Maybe some commodities like oil will be cheaper and give a boost to the U.S. economy ... maybe the saving rate will fall further and consumption will continue to grow faster than income ... maybe residential investment will pick up sooner than I expect ... maybe. But this suggests a 2nd half slowdown to me.
Residential Investment Components Q1 2010
by Calculated Risk on 5/04/2010 02:57:00 PM
More from the Q1 2010 GDP underlying detail tables ...
Note: Residential investment (RI), according to the Bureau of Economic Analysis (BEA), includes new single family structures, multifamily structures, home improvement, broker's commissions, and a few minor categories.
Back in Q4 2008 - for the first time ever - investment in home improvements exceeded investment in new single family structures. This has continued through Q1 2010. Click on graph for larger image in new window.
This graph shows the various components of RI as a percent of GDP for the last 50 years. The most important components are investment in single family structures followed by home improvement.
Investment in home improvement was at a $152.9 billion Seasonally Adjusted Annual Rate (SAAR) in Q1, significantly above the level of investment in single family structures of $115.2 billion (SAAR).
Home improvement spending, as a percent of GDP, is close to the long term median - although still declining. Brokers' commissions declined after the initial expiration of the tax credit - but will probably be boosted in Q2 by the extension of the homebuyer tax credit - and then will decline again in Q3.
Investment in single family structures is above the record low set in Q2 2009, and far below the normal level. And investment in multifamily structures is still collapsing. These two categories will not increase significantly until the number of excess housing units is reduced.


