by Calculated Risk on 2/27/2009 03:59:00 PM
Friday, February 27, 2009
Party Like It's ... 1996
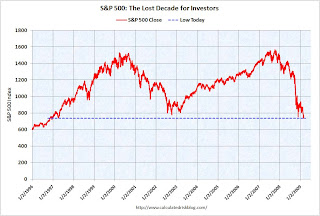
The S&P 500 closed at 735 or so. The low in 1997 was 737.01.
Note: the S&P 500 was at 744 when Greenspan spoke of "irrational exuberance"! Click on graph for larger image in new window.
DOW off 1.6%
S&P 500 off 2.3%
NASDAQ off 1.0%
The second graph is from Doug Short of dshort.com (financial planner): "Four Bad Bears". (Doug should update soon)
Note that the Great Depression crash is based on the DOW; the three others are for the S&P 500.
California Unemployment Rate Hits Double Digits
by Calculated Risk on 2/27/2009 03:17:00 PM
From the LA Times: California unemployment rate reaches 10.1%
More than 1 in 10 California workers were unemployed in January ...Ouch.
The 10.1% jobless rate is the highest since June 1983 and not far below the 11% record set in November 1982 at the worst point of a severe recession ... Job losses escalated in January, with the state's unemployment rate jumping by 1.4 percentage points from a revised 8.7% for December.
Investment Contributions to GDP
by Calculated Risk on 2/27/2009 02:00:00 PM
The following graph shows the contribution to GDP from residential investment, equipment and software, and nonresidential structures. The graph shows the rolling 4 quarters for each investment category.
This is important to follow because residential tends to lead the economy, equipment and software is generally coincident, and nonresidential structure investment trails the economy. Click on graph for larger image in new window.
Residential investment (red) has been a huge drag on the economy for the last couple of years. The good news is the drag is getting smaller, and the drag on GDP will be significantly less in 2009, than in 2007 and 2008.
Even if there is no rebound in residential investment later this year, the drag will be less because there isn't much residential investment left! The bad news is any rebound in residential investment will probably be small because of the huge overhang of existing inventory.
The REALLY bad news is nonresidential investment (blue) is about to fall off a cliff. Nonresidential investment subtracted -0.24% (SAAR) from GDP in Q4, and will decline sharply in 2009 based on the Fed's Senior Loan Officer Survey, the Architecture Billings Index, and many many other reports and stories. In previous downturns the economy recovered long before nonresidential investment - and that will probably be true again this time.
As always, residential investment is the investment area to follow - it is the best predictor of future economic activity.
GE Cuts Dividend
by Calculated Risk on 2/27/2009 01:49:00 PM
This is a big story because it shows how quickly the economy has changed. Just last November, GE once again promised not to cut the dividend through the end of 2009.
From MarketWatch: GE to cut dividend to 10 cents from 31 cents: WSJ
General Electric will cut its quarterly dividend to 10 cents from 31 cents, the Wall Street Journal reported on its Web site Friday.And from GE last November: An update on the GE dividend
On Sept. 25, GE stated that its Board of Directors had approved management’s plan to maintain GE’s quarterly dividend of $0.31 per share, totaling $1.24 per share annually, through the end of 2009. That plan is unchanged.This dividend cut was inevitable. But hoocoodanode? Apparently not GE management.
The Stress Test Schedule
by Calculated Risk on 2/27/2009 12:05:00 PM
It has been widely reported that the stress tests will be completed "no later than the end of April", based on this FAQ:
Q10: When will the process be completed?Just to let everyone know, I've heard the banks have been told to submit their stress test results by Wednesday March 11th. Too bad the results will not be made public.
A: The Federal supervisory agencies will conclude their work as soon as possible, but no later than the end of April.
UPDATE: Questions from a reader:
Just to repeat the first question: With all that is happening in Asia and Europe (especially the exposure to Eastern Europe and other emerging markets), what are the macro assumptions for these markets? I'm sure other readers have excellent questions too.The Fed published macroeconomic assumptions for the US. What about international markets? Should the banks assume mark-to-market accounting will stay or will be repealed? Should the banks still assume that in 2010 they will have to bring off-balance sheet exposures back on their books?
Restaurant Performance Index Rebounds Slightly
by Calculated Risk on 2/27/2009 10:57:00 AM
From the National Restaurant Association (NRA): Restaurant Industry Outlook Improved Somewhat in January as Restaurant Performance Index Rebounded From December’s Record Low
The outlook for the restaurant industry improved somewhat in January, as the National Restaurant Association’s comprehensive index of restaurant activity bounced back from December’s record low. The Association’s Restaurant Performance Index (RPI) – a monthly composite index that tracks the health of and outlook for the U.S. restaurant industry – stood at 97.4 in January, up 1.0 percent from December’s record low level of 96.4.
“Despite the encouraging January gain, the RPI remained below 100 for the 15th consecutive month, which signifies contraction in the key industry indicators,” said Hudson Riehle, senior vice president of Research and Information Services for the Association. “Same-store sales and customer traffic remained negative in January, and only one out of four operators expect to have stronger sales in six months.”
...
Restaurant operators reported negative customer traffic levels for the 17th consecutive month in January.
...
Along with soft sales and traffic levels, capital spending activity remained dampened in recent months. Thirty-four percent of operators said they made a capital expenditure for equipment, expansion or remodeling during the last three months, matching the proportion who reported similarly last month and tied for the lowest level on record.
emphasis added
 Click on graph for larger image in new window.
Unfortunately the data for this index only goes back to 2002.
The index values above 100 indicate a period of expansion; index values below 100 indicate a period of contraction.
Based on this indicator, the restaurant industry has been contracting since November 2007. Also note the record low business investment by restaurant operators - this is happening in most industries, and is showing up as a significant decline in equipment and software investment in the GDP report (-28.8% annualized in the Q4 report!)
Citi Deal Details
by Calculated Risk on 2/27/2009 09:13:00 AM
From the NY Times: U.S. Agrees to Raise Its Stake in Citigroup
[T]he government will increase its stake in the company to 36 percent from 8 percent.From MarketWatch: Citi CEO says latest deal should end nationalization fear
...
Under the deal, Citibank said that it would offer to exchange common stock for up to $27.5 billion of its existing preferred securities and trust preferred securities at a conversion price of $3.25 a share, a 32 percent premium over Thursday’s closing price.
The government will match this exchange up to a maximum of $25 billion of its preferred stock at the same price. In its statement, the Treasury Department said the dollar-for-dollar match was intended to strengthen Citigroup’s capital base.
The government of Singapore Investment Corporation, Saudi Prince Walid bin Talal, Capital Research Global Investors and Capital World Investors have already agreed to participate in the exchange, Citibank said in a statement. Existing shareholders will own about 26 percent of the outstanding shares.
...
The bank will also suspend dividends on its preferred shares and its common stock.
"[F]or those people who have a concern about nationalization, this announcement should put those concerns to rest," Pandit said.Here is the Treasury statement: Treasury Announces Participation in Citigroup's Exchange Offering
GDP Revision: Q4 GDP Declined at 6.2%
by Calculated Risk on 2/27/2009 09:00:00 AM
From the WSJ: GDP Shrank 6.2% in 4th Quarter, Deeper Than First Thought
The U.S. recession deepened a lot more in late 2008 than first reported, according to government data showing a big revision down because businesses cut supplies to adjust for shriveling demand.I'll have more on investment, but this is more in line with expectations in Q4.
...
The sharply lower revision to a decline of 6.2% reflected adjustments downward of inventory investment, exports and consumer spending.
The report showed businesses inventories shrank $19.9 billion in the fourth quarter, instead of rising by $6.2 billion as Commerce originally estimated.
...
Fourth-quarter investment in structures decreased 5.9%. Equipment and software plunged 28.8%.
Report: Citi and U.S. Government Reach Agreement
by Calculated Risk on 2/27/2009 12:07:00 AM
From the WSJ: Citi, U.S. Reach Deal on Government Stake
... expected to be announced Friday morning ... the Treasury has agreed to convert some of its current holdings of preferred Citigroup shares into common stock ... The government will convert its stake only to the extent that Citigroup can persuade private investors such as sovereign wealth funds do so as well ... The Treasury will match private investors' conversions dollar-for-dollar up to $25 billion.MarketWatch has some details.
The size of the government's new stake will hinge on how many preferred shares private investors agree to convert into common stock. The Treasury's stake is expected to rise to up to 40% of Citigroup, the people said.
Thursday, February 26, 2009
Summary Post: New Home Sales at Record Low
by Calculated Risk on 2/26/2009 08:34:00 PM
Another summary post and open thread (for discussion).
New home sales in January 2009 (309 thousand SAAR) were 10.2% lower than last month, and were 48% lower than January 2008 (597 million SAAR). See link for graphs of sales and inventory.
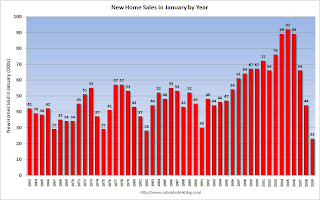
There was some discussion that the seasonal adjustment might be distorting the sales number. The following graph of the January sales numbers (no adjustment) shows this decline in sales wasn't a seasonal issue.  Click on graph for larger image in new window.
This shows the Census Bureau reported sales for every January since 1963. The label is the sales for the month (in thousands).
Clearly January 2009 was the worst ever - and this wasn't adjusted for changes in population either, and the U.S. population has grown substantially since 1963.
Initial unemployment claims hit 667,000 last week (highest since 1982) and continued claims were over 5 million for the first time ever. The numbers aren't quite as bad when adjusted by covered employment (see graphs)
Here was an analysis on the impact of falling rents: What If Rents Cliff Dive?
Fannie Mae reported a loss of $25.2 billion, the U.S. may backstop AIG CDS losses (likely to be announced Sunday or Monday morning), and oh yeah, we are still waiting for the Citi deal!
Scroll down for more ... and there will probably be more tonight. Best to all.


