by Calculated Risk on 6/25/2008 10:00:00 AM
Wednesday, June 25, 2008
May New Home Sales: 512K Annual Rate
According to the Census Bureau report, New Home Sales in May were at a seasonally adjusted annual rate of 512 thousand. Sales for April were revised down slightly to 525 thousand (from 526 thousand). Click on graph for larger image in new window.
The first graph shows monthly new home sales (NSA - Not Seasonally Adjusted).
Notice the Red columns for 2008. This is the lowest sales for May since the recession of '91.
As the graph indicates, the spring selling season has never really started. The second graph shows New Home Sales vs. recessions for the last 45 years. New Home sales have fallen off a cliff.
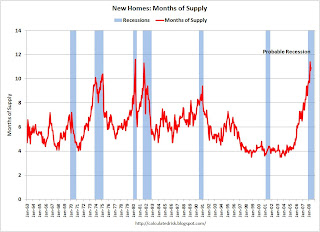
Sales of new one-family houses in May 2008 were at a seasonally adjusted annual rate of 512,000, according to estimates released jointly today by the U.S. Census Bureau and the Department of Housing and Urban Development. This is 2.5 percent below the revised April rate of 525,000 and is 40.3 percent below the May 2007 estimate of 857,000.And one more long term graph - this one for New Home Months of Supply.
 "Months of supply" is at 10.9 months. Note that this doesn't include cancellations, but that was true for the earlier periods too.
The all time high for Months of Supply was 11.6 months in April 1980.
Once again, the current recession is "probable" and hasn't been declared by NBER.
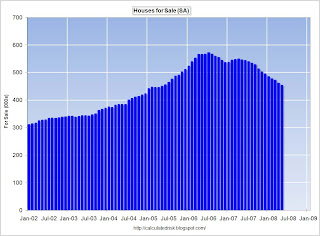
And on inventory:

The seasonally adjusted estimate of new houses for sale at the end of May was 453,000. This represents a supply of 10.9 months at the current sales rate.Inventory numbers from the Census Bureau do not include cancellations - and cancellations are near record levels. Actual New Home inventories are probably much higher than reported - my estimate is just under 100K higher.
Still, the 453,000 units of inventory is below the levels of the last year, and it appears that even including cancellations, inventory is now falling.
This is another very weak report for New Home sales and I'll have more later.
Illinois Sues Countrywide
by Tanta on 6/25/2008 08:12:00 AM
As usual, I can't tell if this sounds a little absurd because the complaint is this weak or because all I have to go on is the Gretchen Morgenson Version of the complaint.
The Illinois complaint was derived from 111,000 pages of Countrywide documents and interviews with former employees. It paints a picture of a lending machine that was more concerned with volume of loans than quality.Volume-based compensation structures? There have been volume-based compensation structures in this business since long before Tanta got into it. Does it create perverse incentives? Sure. Do we have to like it? No. Has it operated all these years in plain sight of regulators, investors, and the public? Yes. Is CFC's pay structure all that different from anyone else's? I profoundly doubt it.
For example, former employees told Illinois investigators that Countrywide’s pay structure encouraged them to make as many loans as they could; some reduced-documentation loans took as little as 30 minutes to underwrite, the complaint said.
And if anyone who has ever underwritten a loan in 30 minutes has to go to jail, the jails will be full indeed. I wonder if they'll let me take my new Kindle. Jesus H. Christ on a Process Re-engineering Consultant Binge, folks, anybody who didn't tell the analysts on the conference calls that they'd got their average underwriting time down to 30 minutes was Nobody back in 2000. Not to mention the AUS side of the business where underwriting had gotten down to 30 seconds.
The lawsuit cited Countrywide documents indicating that almost 60 percent of its borrowers in subprime adjustable rate mortgages requiring minimal payments in the early years, known as hybrid A.R.M.’s, would not have qualified at the full payment rate. Countrywide also acknowledged that almost 25 percent of the borrowers would not have qualified for any other mortgage product that it sold.It is now grounds for a lawsuit that you have borrowers in your lowest credit quality product who do not qualify for any alternative product? Um. We used to think that if borrowers in your lowest credit quality product could have qualified for an alternative product, you might be guilty of predatory "steering." Now you're also guilty of predatory lending if indeed the borrowers at the bottom of the pile only qualify there? Every lender has borrowers in, say, its FHA product who could not not qualify for any other mortgage product it sells. Are we going to call that a problem? That'd get pretty interesting pretty fast.
Even more surprising, Ms. Madigan said, was her office’s discovery of e-mail messages automatically sent by Countrywide to its borrowers offering complimentary loan reviews one year after they obtained their mortgages from the company.Lisa Madigan cannot be such a Pangloss as to be bowled over by the idea that lenders solicit their current loan customers for refinances. She can't.
“Happy Anniversary!” the e-mail messages stated. “Many home values skyrocketed over the past year. That means that you may have thousands of dollars of home equity to borrow from at rates much lower than most credit cards.”
Ms. Madigan said, “I was just struck that on the first anniversary of these people’s loans they would get these e-mails luring them into a refinance, into another unaffordable product to generate more fees and originate more loans.”
Nobody has to like any of these business practices. But they have been hiding in plain sight for a long, long time. This ginned-up outraged innocence--all directed at Countrywide, as if everyone else in the industry had never heard of any of this--is truly getting on my nerves.
More on the Decline of the Exurban Lifestyle
by Calculated Risk on 6/25/2008 01:40:00 AM
Peter Goodman at the NY Times writes about an upscale Denver exurb that is getting hit hard by a combination of the housing bust and high oil prices: Rethinking the Country Life as Energy Costs Rise. Here is a great quote:
“Living closer in, in a smaller space, where you don’t have that commute,” [Denver exurbanite Phil Boyle] said. “It’s definitely something we talk about. Before it was ‘we spend too much time driving.’ Now, it’s ‘we spend too much time and money driving.’ ”Michael Corkery at the WSJ writes in the Development blog: Rising Gas Prices Crushing Housing Recovery in Inland Empire
Even though falling prices in California’s Inland Empire are making homes more affordable, rising gasoline prices are crushing hopes of a housing recovery in this area, east of Los Angeles.This is a problem all over the country, see this Bloomberg story on the Washington area: Wealth Evaporates as Gas Prices Clobber McMansions, or this post on Temecula, CA.
...
“Land that was purchased with expanding metro areas in mind has already been hard hit in value,” says [Deutsche Bank analyst Nishu Sood]. ”Sustained higher gas prices could render it effectively worthless.”
As I noted before, any lifestyle dependent on low gas prices - and low gas mileage vehicles - is becoming uneconomical. For those that own a home in a remote location, work in construction, and drive a low gas mileage vehicle, this must feel like a depression.
How bad are things at Wachovia?
by Calculated Risk on 6/25/2008 12:08:00 AM
From MarketWatch: Wachovia hires Goldman to help sort loan portfolio (hat tip Mark)
Wachovia Corp. said Tuesday that it has hired Goldman Sachs Group to review its loan portfolio, another sign that the bank is bracing for further mortgage-related trouble when it reports earnings next month.The key problem for Wachovia is the $120 Billion Pick-a-pay portfolio (Option ARMs) that came with the Golden West acquisition in 2005.
...
Wachovia has written down more than $5 billion in bad investments over the last year ...
Tuesday, June 24, 2008
WaMu Analyst Competition
by Calculated Risk on 6/24/2008 07:45:00 PM
From Matt Padilla at the O.C. Register: How bad are things at WaMu?
Lately equities analysts seem to be competing on who can make the most dire prediction for Washington Mutual’s future loan losses.Wow. $30 billion. That is a huge number. But in the current environment, I'll take the over. Or is that the under when we are talking about losses? See Matt's post for more.
Reuters reports today that WaMu, as the company is known, may set aside as much as $30 billion in credit losses through 2011, predicts Lehman Brothers analyst Bruce Harting.
That tops the $27 billion of losses that UBS analyst Eric Wasserstrom on June 9 said the nation’s largest thrift could face.
Case-Shiller: Tiered Home Price Indices
by Calculated Risk on 6/24/2008 05:32:00 PM
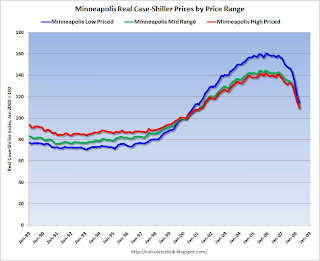
Here is a look at the Case-Shiller data by price tiers for two cities. See this spread sheet from S&P for tiered pricing for all 20 cities in the Composite 20 index. (note: this is an S&P excel spread sheet, not mine.). Click on graph for larger image in new window.
The first graph shows the real Case-Shiller prices for homes in Los Angeles.
The low price range is less than $408,960 (current dollars). Prices in this range have fallen 37.9% from the peak in real terms.
The mid-range is $408,960 to $617,001. Prices have fallen 32.5% in real terms.
The high price range is above $617,001. Prices have fallen 24.1% in real terms. The second graphs show the real Case-Shiller prices for homes in Minneapolis.
The low price range is less than $173,578 (current dollars). Prices in this range have fallen 28.8% from the peak in real terms.
The mid-range is $173,578 to $247,371. Prices have fallen 23.1% in real terms.
The high price range is above $247,371. Prices have fallen 23.2% in real terms.
In both of these cities, the low end areas saw the most appreciation, and have seen the fastest price declines.
In a number of previous housing busts, real prices declined for 5 to 7 years before finally hitting bottom. If this bust follows that pattern, we will continue to see real price declines for several more years - but if that happens, the rate of decline will probably slow (imagine somewhat of a bell curve on those graphs).
However, with the record foreclosure activity, prices might adjust quicker than normal (lenders are less prone to sticky prices than ordinary homeowners).
Foreclosure Rage: Take Everything, including the Kitchen Sink
by Calculated Risk on 6/24/2008 03:58:00 PM
This story (2 min 44 secs) starts with that guy in Las Vegas destroying his home. But there is more here - check out the house with all the appliances removed.
Update: Ratio Median House Price to Median Income (2008 Report)
by Calculated Risk on 6/24/2008 02:23:00 PM
A research analyst at Harvard Joint Center for Housing Studies (JCHS) has been kind enough to send me (Thanks!) an update to the median house price to median income ratio I discussed yesterday (see: Ratio: Median Home Price to Median Income)
JCHS didn't post this data because they changed both the data source they use, and their methodology to calculated the ratio - and JCHS analysts felt this would be confusing because the ratios are different from previous releases. However the trends are the same - and therefore useful for us.
Here is some price-to-income data from the 2008 report (data through 2007). Once again I picked a few key cities and plotted the national average (dashed). Note: the new data only goes back to 1989. Click on graph for larger image in new window.
Different areas have different price to income ratios. There are several reasons for this (land restrictions, demographics), but on a national basis, the median price to median income ratio rose from around 3.5 in the 1990s, to 4.7 in 2005, and has started to decline since then. This would suggest that a combination of falling prices and rising incomes would need to adjust this ratio by about 25% from peak to trough.
For Los Angeles, it is reasonable to expect the price to income ratio to fall to below 5. This suggests prices at the peak were about twice as high as normal.
Hold on, you say ... the above graph shows the price-to-income ratio for Los Angeles only declined about 3% from 2006 to 2007, but Case-Shiller showed prices in Los Angeles declined 14% in 2007 ... what gives?
Although I don't know the exact methodology used by JCHS, the likely reason for the difference is the JCHS data is based on the annual average, whereas the Case-Shiller data is from the end of 2006 to the end of 2007. 
The second graph illustrates this point for Los Angeles. The red line is the JCHS median price to median income ratio for LA.
UPDATE: For Case-Shiller Index, Jan 2000 = 100.
The blue line is the annual average of the mid tier Case-Shiller index (mid tier was used to approximate the median price). The difference between the red and blue lines is that nominal median incomes are increasing. This is exactly what we would expect.
The dashed line is the monthly Case-Shiller mid tier price index. This has fallen off a cliff. It is very likely that the median price to median income ratio (on a monthly basis if it was available) would now be around 7 or lower - well on the way to the historical norm of around 4.7.
GSEs Refuse To Save The Day
by Tanta on 6/24/2008 12:37:00 PM
The rhetoric of this Bloomberg report has to be read to be believed. Apparently, Fannie and Freddie have power make benefit glorious Nation of Jumbo, and they're blowing it all on people with downpayments in non-bubble markets instead of single-handedly throwing themselves on the grenade to Save the Housing Economy. Really:
June 24 (Bloomberg) -- Three months after Fannie Mae and Freddie Mac won the freedom to step up home-loan purchases, the government-chartered mortgage-finance companies are doing what critics in the Federal Reserve and Congress had predicted. . . .
``They were granted expanded opportunity to help recovery in a troubled housing market and yet have appeared to focus on their own recovery,'' said former U.S. Representative Richard Baker, a critic of the companies who left office earlier this year to run the Managed Funds Association in Washington. . . .
The slowness of Fannie Mae and Freddie Mac in injecting cash for new jumbo loans may have exacerbated the housing slump in markets including California and Florida, where prices have already fallen more than the national average, said Jerry Howard, 53, president of the National Association of Home Builders.
``Had they been quicker into the marketplace, they could have helped slow the downward spiral in housing prices,'' Howard said. . . .
``Fannie and Freddie are catering to low-risk homeowners with high credit scores and a lot of equity in their homes,'' said Dan Green, a loan broker at Mobium Mortgage Group Inc. in Cincinnati and Chicago. ``I'm sure there will be some high-cost areas in the country that will benefit. They just don't happen to be Florida, Michigan, California, Nevada.''
Case-Shiller Home Prices: Selected Cities
by Calculated Risk on 6/24/2008 10:40:00 AM
As noted earlier, S&P reported that the Case-Shiller home price composite indices declined sharply in April. The Case-Shiller composite 20 index (20 large cities) was off 15.3% YoY through April, and off 17.8% from the peak.
Note: the composite 20 index is not the National Price index, but this does suggests the national index will be off sharply in Q2.
However, 8 of the 12 cities in the composite 20 saw month to month price increases. Click on graph for larger image in new window.
This graph shows the price changes for several selected cities that I've been following. Prices continue to fall in the 'bubble' cities, like San Diego, Miami, and Las Vegas.
Prices actually rose slightly in areas that saw less appreciation, like Denver and Cleveland. However this could just be seasonal noise, as these cities saw small increases last year at this time too.


