 RSS Feed
 by Calculated Risk on 2/26/2008 10:36:00 AM
Tuesday, February 26, 2008
OFHEO: Widspread House Price Declines in Q4
From OFHEO: Widespread House Price Declines in Q4
U.S. home prices fell in the fourth quarter of 2007 according to OFHEO’s seasonally-adjusted purchase-only house price index. The index, which is based on data from home sales, was 1.3 percent lower on a seasonally-adjusted basis in the fourth quarter than in the third quarter of 2007. This decline was substantially greater than the 0.3 percent price decline between the second and third quarters. Over the past year, prices fell 0.3 percent, as the fourth quarter decline erased earlier price gains.OFHEO is finally showing significant price declines. More later ...
...
“The year 2007 showed the first four-quarter decline in the purchase-only index since its earliest data in 1991,” [OFHEO Director James B. Lockhart] added.
... prices declined 0.2 percent in December across the U.S., on average. This is the sixth consecutive monthly decline, bringing the total drop from the April 2007 peak to 2.4 percent.
S&P Case-Shiller: Prices Fall Sharply in Q4 2007
by Calculated Risk on 2/26/2008 09:27:00 AM
S&P Case-Shiller reported that house prices fell sharply in Q4 2007. Click on graph for larger image.
The first graph shows the Case-Shiller index since 1987. The index fell to 170.64 in Q4, from 180.31 in Q3. A decline of 5.3%, or over 20% at an annual rate.
This is the lowest level for the index since Q1 2005.  The second graph shows the year-over-year change in the Case-Shiller index.
Prices fell 8.9% in 2007 according to Case-Shiller.
The index is off 10.2% from the peak.
Existing Home Inventory: Seasonal Pattern
by Calculated Risk on 2/26/2008 12:18:00 AM
The following graph shows the seasonal pattern for existing home inventory. Each year is normalized to 100 at the ending level of the prior year.
The dashed lines are the final boom years (2002, 2003, and 2004) and the solid lines are the bust years (2005, 2006, 2007, and 2008 through January in red).
Actually 2005 was a transition year from boom to bust. The inventory pattern started out looking like a boom year, but then inventory kept building all year; the first clear signal that the housing bubble was over. Click on graph for larger image.
During the first few months of each year, there is little difference between the boom and bust seasonal patterns. The main difference happens in the summer when the inventory just keeps building during a housing bust.
For 2008, inventory has already increased 5.4% from the 2007 year end level. Another 10% increase (to the 115 line on the graph) and the inventory will be at a record all time level (the record is 4.561 million in July 2007).
If the inventory increases 25% from year end (at the low end of the housing bust years), then inventory would reach 5 million units, and that would put the "months of sales" over 12 months, at the current sales pace. I expect Months of Supply to be over 12 soon, possibly as early as May or June.
Monday, February 25, 2008
FDIC Bracing for Bank Failures
by Calculated Risk on 2/25/2008 09:49:00 PM
From the WSJ: FDIC Readies for a Rise in Bank Failures (hat tip Peter)
The Federal Deposit Insurance Corp. is taking steps to brace for an increase in failed financial institutions as the nation's housing and credit markets continue to worsen.Frequent contributor FFIDC has mentioned these hiring efforts for months in the comments. I expect quite a few bank failures over the next couple of years, mostly due to bad Construction & Development (C&D) and Commercial Real Estate (CRE) loans.
FDIC spokesman Andrew Gray said the agency was looking to bulk up "for preparedness purposes." ...
The agency, which insures accounts at more than 8,000 financial institutions, is also seeking to hire an outside firm that would help manage mortgages and other assets at insolvent banks, according to a newspaper advertisement.
...
"Regulators are bracing for well over 100 bank failures in the next 12 to 24 months, with concentrations in Rust Belt states like Michigan and Ohio, and the states that are suffering severe housing-market problems like California, Florida, and Georgia," said Jaret Seiberg, Washington policy analyst for financial-services firm Stanford Group.
Look at the concentration of C&D loans in late 2006 (from the FDIC Semiannual Report: Economic Conditions and Emerging Risks in Banking):
Small and mid-size institutions have been increasing their concentrations in riskier assets, such as CRE loans and construction and development (C&D) loans. This suggests that, although small and mid-size institutions have been more successful in limiting the erosion of their nominal NIMs, they have achieved this success in part by assuming higher levels of credit risk.
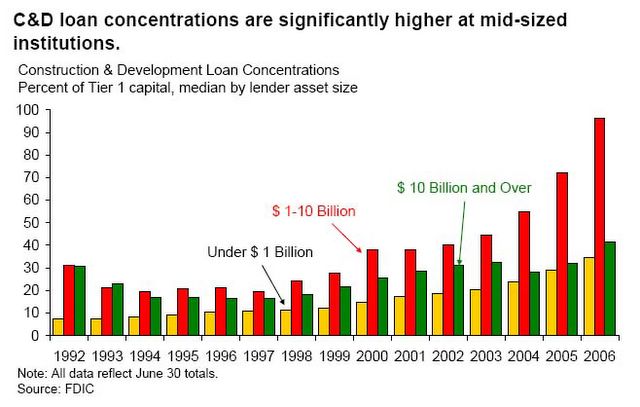
... continued increases in concentrations and reports of loosened underwriting standards at FDIC-insured institutions signal the potential for future credit quality deterioration. In addition, regulators have noted increasing C&D and overall CRE loanAnd that was in late 2006; C&D and CRE lending really went crazy in 2007.
concentrations, especially at institutions with total assets between $1 billion and $10 billion. Four of six Regional Risk Committees expressed some level of concern about CRE lending, in part due to continuing increases in concentrations.
MBIA Plans to Split, Cuts Dividend, Questions 2007 Results
by Calculated Risk on 2/25/2008 06:17:00 PM
From Bloomberg: MBIA Plans to Split Asset-Backed, Municipal Units
MBIA Inc., ... will separate its municipal unit from the asset-backed securities it guarantees within five years after posting record losses on subprime debt.From MBIA: MBIA Inc. Eliminates Quarterly Dividend
The Armonk, New York-based company will stop writing asset- backed securities guarantees for six months, new Chief Executive Officer Jay Brown said in a letter to shareholders today. Brown also said he has ``questions'' about the company's 2007 preliminary results released last month and hasn't yet signed off the statements.
...
``Everything we are working towards right now is centered on regaining stability,'' Brown said in the letter. ``We can expect a bumpy ride over the coming months and possibly longer.''
MBIA Inc. today announced that its Board of Directors voted to eliminate the quarterly dividend.Split within 5 years? Why even mention it now?
Add: MBIA Issues Letter to Owners (hat tip risk capital)
"Here Comes Another Bubble"
by Calculated Risk on 2/25/2008 05:34:00 PM
This is just for afternoon entertainment and isn't a reflection of Tanta or my views. CR
Morgan Stanley on CRE
by Calculated Risk on 2/25/2008 03:53:00 PM
We've been debating in the comments whether the Commercial Real Estate (CRE) bust would be similar to the Residential Real Estate bust.
Richard Berner at Morgan Stanley writes that the "contraction in [CRE construction] outlays will be shallow", see: Recession Claims Its Next Victim: Commercial Construction
Recession is about to claim its next victim: Commercial construction. A downturn in such activity would represent a significant turnaround from last year’s boom: Although nonresidential or structures investment accounted for only 3.4% of (nominal) GDP, the 16% jump in real outlays contributed half a point to overall real GDP growth over the four quarters of 2007. Such a gain — the sharpest 4-quarter rise since 1984 — is unsustainable, and we think this economic asset is about to turn into a liability. Tighter financial conditions, uncertain tenancy, rents, and property values all will contribute to a downturn in office, retail and warehouse activity. Soaring construction costs are also a negative. Weakness is already showing: Nonresidential construction starts tumbled 13% from a year ago in January, according to Reed Construction Data.This is similar to my view that the CRE bust is here, but that it will not be as bad as the residential bust - simply because CRE wasn't as overbuilt as residential.
Despite these hurdles, we think that the contraction in outlays will be shallow by historical comparison. The key factor limiting the downturn in traditional commercial construction is that the overall growth in supply for much of this expansion has been modest by historical standards. The “capital discipline” theme that governed corporate spending in this expansion partly extended to construction as well. For example, commercial construction excluding healthcare facilities rose by only 3.9% annualized over the past five years.
But discipline seems to have faded over the past year, when construction accelerated in virtually all categories, and with the slowdown in business activity, vacancy rates have begun to rise. There are clear pockets of excess in financial services office building and in retail and lodging. A slowdown in office employment and shakeouts in retail and wholesale activity may pressure rents just as lenders and investors tighten credit availability and raise its price. However, mining, power, and healthcare construction may buck the trend.
S&P: MBIA Removed from CreditWatch Negative
by Calculated Risk on 2/25/2008 02:41:00 PM
From Standard & Poor's: S&P Takes Additional Bond Insurer Rtg Actions (no link)
NEW YORK (Standard & Poor's) Feb. 25, 2008-Standard & Poor's Ratings Services today took rating actions on several monoline bond insurers following additional stress tests with respect to their domestic nonprime mortgage exposure.The financial strength ratings on XL Capital Assurance Inc. (XLCA) and XL Financial Assurance Ltd. (XLFA) were lowered to 'A-' from 'AAA' and remain on CreditWatch with negative implications;The downgrades on XLCA, XLFA, XL Capital Assurance (UK) Ltd., and Twin Reefs Pass-Through Trust (a committed capital facility supported by, and for the benefit of, XLFA) reflect our assessment that the company's evolving capital
The financial strength rating on Financial Guaranty Insurance Co. (FGIC) was lowered to 'A' from 'AA' and remains on CreditWatch with developing implications;
The 'AAA' financial strength rating on MBIA Insurance Corp. was removed from CreditWatch and a negative outlook was assigned;
The 'AAA' financial strength rating on Ambac Assurance Corp. was affirmed and remains on CreditWatch with negative implications; and
The 'AAA' financial strength ratings on CIFG Guaranty, CIFG Europe, and CIFG Assurance North America Inc. were affirmed and retain a negative outlook.
plan has meaningful execution and timing risk.
The downgrades on FGIC, FGIC Corp., and Grand Central Capital Trusts I-VI (a committed capital facility supported by, and for the benefit of, FGIC) reflect
our current assessment of potential losses, which is higher than previous estimates.
The removal from CreditWatch of, and assignment of negative outlooks on, MBIA Insurance Corp., MBIA Inc., and North Castle Custodial Trusts I-VIII (a committed capital facility supported by, and for the benefit of, MBIA) reflect MBIA's success in accessing $2.6 billion of additional claims-paying resources, which, in our view, is a strong statement of management's ability to address the concerns relating to the capital adequacy of the company.
...
More on Existing Home Sales
by Calculated Risk on 2/25/2008 02:14:00 PM
Here is a graph of Not Seasonally Adjusted existing home sales for 2005 through 2008. Click on graph for larger image.
This graph shows that sales have plunged in January 2008 compared to the previous three years. This also shows that January is typically the least important month of the year for existing home sales.
The data for March will be much more important since that is the beginning of the Spring selling season. The second graph shows existing home sales, on a Seasonally Adjusted Annual Rate (SAAR) basis since 1993.
January 2008 (4.89 million SAAR) was the weakest January since 1998 (4.37 million SAAR).
Finally the inventory increase of about 5% from December to January was typical. Last year, from December 2006 to January 2007, inventory increased 2.5% (from 3.45 millon to 3.539 million). The total inventory increase in 2007 was almost 33% from December 2006 to July 2007 (4.561 million).
A similar inventory increase this year would put inventory at 5.2 million or about 15% above the all time record set last July.
The Coming Leveraged Debt Write-Downs
by Calculated Risk on 2/25/2008 11:43:00 AM
Goldman Sachs, in a research note this morning, noted that they expect "major write-downs" in leveraged loans this quarter. They estimated leveraged debt write-downs this quarter of $1B to $2B for several firms, with write-downs at Citi of $2.2B and Merrill of $1.3B.
Update: This is just the leveraged debt write-downs. Total write-downs at Citi could be $12 Billion (see MarketWatch: More credit costs seen weighing on banks, brokers)
They also noted there will be significant write-downs for RMBS and CMBS (residential and commercial mortgage backed securities) with special concern about CMBS.
Of course Goldman doesn't cover Goldman. But others do ...
From the WSJ: Goldman's Profit Magic May Be Fading
One of the biggest worries is Goldman's large exposure to leveraged loans, which totaled $42 billion at the end of the firm's last quarter, according to analyst calculations. During the deal boom, Goldman was a huge player in financing private-equity buyouts. But investors started to avoid buyout loans last summer, causing the debt to pile up on balance sheets and their market values to drop.And it could be worse if one or more of the large LBO companies defaults on their debt. As the WSJ noted:
The result: Goldman is in the sort of sticky situation it largely avoided with subprime mortgages. The firm's leveraged-loan exposure is equivalent to 1.1 times its net worth, versus an average of 0.7 times for U.S. brokerage firms, according to Credit Suisse analyst Susan Roth Katzke. Write-downs on leveraged loans could total as much as $1.7 billion in the current quarter, Mr. Trone estimates.
[A]larming news, like the bankruptcy filing of a company overwhelmed by its LBO-related debt, would raise the specter of more steep markdowns.


