 RSS Feed
 by Calculated Risk on 12/22/2006 02:45:00 PM
Friday, December 22, 2006
Fed: Mortgage Obligation Ratio at Record Levels in Q3
The Federal Reserve released the "Household Debt Service and Financial Obligations Ratios" for Q3 2006 today.
DEFINITIONS: The household debt service ratio (DSR) is an estimate of the ratio of debt payments to disposable personal income. Debt payments consist of the estimated required payments on outstanding mortgage and consumer debt.The owner FOR (Financial Obligation Ratio) was 18.16% in Q3 '06, off slightly from the revised 18.17% for Q2 '06 (Q2 was originally reported at 18.06%)
The financial obligations ratio (FOR) adds automobile lease payments, rental payments on tenant-occupied property, homeowners' insurance, and property tax payments to the debt service ratio.
The mortgage portion of the FOR set a new record at 11.68%, up slightly from 11.65% in Q2 '06. (Q2 was originally 11.60%)
The household DSR (Debt Service ratio) was off slightly at 14.49%, from 14.51% in Q2 '06. (Q2 was originally 14.40%)
Note: All of the estimates for Q2 were revised upwards, otherwise these would have been new records across the board.
 Click on graph for larger image.
With relatively low mortgage rates, one might expect the mortgage portion of the FOR to be lower than previous periods, not at record high levels.
Note that the previous housing bubble peaked with the mortgage portion of the FOR at 10.38%.
Core PCE and Savings Rate
by Calculated Risk on 12/22/2006 12:08:00 PM
The BEA reports for November:
Personal income increased $33.8 billion, or 0.3 percent, and disposable personal income (DPI) increased $27.0 billion, or 0.3 percent, in November, according to the Bureau of Economic Analysis. Personal consumption expenditures (PCE) increased $50.5 billion, or 0.5 percent.Some things stay the same:
Personal saving as a percentage of disposable personal income was a negative 1.0 percent in November, compared with a negative 0.7 percent in October.The BEA explains:
Saving from current income may be near zero or negative when outlays are financed by borrowing (including borrowing financed through credit cards or home equity loans), by selling investments or other assets, or by using savings from previous periods.But some thing might have changed:
The Fed's favorite measure of the inflation rate - the change in the core PCE price index - was essentially unchanged in November (0.5% annualized), and the trailing six month change was 2.0% - right at the high end of the Fed's assumed target range (2%). Of course this is just one month's data.
The following graph compares the market-based core PCE vs. the Fed Funds rate for the last seven years.

Click on graph for larger image.
This follows the recent benign report on CPI. PPI was a little high, but Kash suggests: Exaggerated Inflation Worries
At this point, I believe a slowing economy is a greater risk than inflation. However the Fed apparently still thinks inflation is the greater risk (see Dr. Duy's: Fed Watch: Where’s That Recession?. Tim concluded:
"... on balance, these things most likely leave policy makers holding steady, with one foot still hovering over the break, not ready to shift to the accelerator."If inflation stays benign, the Fed has their foot on the break even without raising rates.
Thursday, December 21, 2006
Fed's Lacker: Economic Outlook
by Calculated Risk on 12/21/2006 03:41:00 PM
Jeffrey M. Lacker, President, Federal Reserve Bank of Richmond, spoke today on the economic outlook, with several comments on housing.
Since growth clearly has slowed, the question on many people's minds is, "What's next?"This "several month" time frame seems very optimistic.
...
The distinguishing feature of the current transition is the magnitude of the adjustment in the housing market, which comes at the end of what has been an amazing, decade-long run. The homeownership rate increased by 4 full percentage points from 1995 to 2005, and the number of houses built per year increased by 46 percent over that 10-year period.
...
The secular increase in housing demand in recent years was apparently satisfied in many markets by the end of 2005. Nationwide, new home sales have fallen by 22 percent through October of this year. The pipeline of new projects under construction was not scaled back as rapidly, however, and we now have excess inventories of new and existing homes in most localities. Production of new homes will have to undershoot demand for a time in order to work off the backlog. Indeed, new housing starts have fallen 28 percent through November of this year. The inventory overhang that remains suggests that homebuilding will be below demand for several more months.
Looking ahead, there are tentative signs that the demand for housing has stabilized. New home sales have bumped around the 1 million unit annual rate for the last four months, and new purchase mortgage applications have risen over 15 percent in the last seven weeks. If these tentative signs are confirmed by more complete data then new home construction only needs to lag new home sales long enough to work off the current bulge in inventories. In this scenario, I would expect housing starts to realign with sales around the middle of 2007. Should new home demand deteriorate instead, the adjustment could take longer.This is part of the reason the next 6 months are so important - as Lacker noted, residential construction "has shed 110,000 jobs since the peak in February". But there are 400K to 600K residential construction jobs that will probably be lost over the next 6 months.
In any event, the weakness in housing will continue to be a drag on overall economic activity into the first half of next year, with the effect gradually waning as the year progresses. But I seriously doubt it will be enough of a drag to tip the economy into recession.
...
Could weakness in the housing market spillover and weaken consumption spending as well? As residential investment contracts, construction employment will certainly decline. So far, residential construction employment has shed 110,000 jobs since the peak in February. At the same time, however, other segments of the economy have been doing well and overall payrolls actually expanded by 1.2 million jobs. This again reflects the small size of the residential construction sector relative to the overall economy. Although the outlook is for construction employment to continue to weaken for at least several more months, a decline commensurate with the fall-off we've already seen in housing starts still would have only a minor effect on total employment.
It's not surprising that the economy could absorb the 110K jobs lost so far over a ten month period (about 11K jobs per month), but the rate of job losses is about to increase, and increase significantly. Will the economy be able to absorb that level of losses? That is a key question.
As I have said before, consumer spending is largely determined by current and expected future income prospects. I expect the overall job market to continue to expand even after accounting for further job losses in homebuilding, and I expect the tight labor market to continue to generate healthy wage gains. With income prospects looking good for 2007, it seems a pretty safe bet that consumer spending will do well, and again that's by far the largest part of the economy.The consumer has been relying on personal income and borrowing against assets to sustain spending. With prices stable or declining for the most widely held asset (housing) in 2007, will consumers perceive their total income prospects as "looking good"? That is another key question.
Tanta: On Hybrids, Teasers, and Other Mortgage Guidance Problems
by Calculated Risk on 12/21/2006 11:12:00 AM
According to the LA Times, our friends in the mortgage business have once again been asking the regulators to let this cup pass:
A coalition of nine banking and housing groups, including the American Bankers Assn., asked six federal and state bank regulators to abandon the idea of adding so-called hybrid adjustable-rate mortgages, or hybrid ARMs, to guidelines they put forward in September. . . .I haven’t gotten my hands on a copy of either of these letters yet, so I really have no way of knowing for sure if they’re as stupid as the Times reporter makes them sound. But since the question of the “2/28s” keeps coming up in the comments, I thought I’d at least define a few terms as I understand them, in the naïve hope that this might help us move the ball forward about an inch.
Lawmakers and consumer groups have called on regulators to incorporate the mortgages in the guidelines, which banks use to set underwriting and disclosure standards. The guidelines currently apply to interest-only and payment-option adjustable-rate loans. . . .
In a Dec. 7 letter to regulators, six members of the Senate Banking Committee, including incoming Chairman Christopher J. Dodd (D-Conn.), asked that the hybrid mortgages be included because they "have a number of the same risky attributes" as the mortgages already covered by the guidelines.
First of all, a “hybrid ARM” is called a “hybrid” because it is, basically, a cross between a fixed rate and adjustable rate mortgage. Before the early 90s, an “ARM” basically meant a one-year ARM. The initial interest rate was set for one year, and the rate adjusted every year. The only real variations on this theme involved shortening the adjustment frequency: you could get an ARM that adjusted every six months instead of one year.
Around the early 90s, the “hybrid ARM” was introduced. It had an initial period in which the rate was “fixed” that didn’t match the subsequent adjustment frequency: this is the classic 3/1, 5/1, 7/1, and even 10/1 ARM. The whole idea of the hybrid ARM was to provide a kind of medium-range risk/reward tradeoff for borrowers and lenders. With a fixed rate loan, the borrower gets the security of knowing the payment will never rise, with the potential risk that market rates will go down and that secure fixed payment will be expensive relative to market rates. With an old-fashioned one-year ARM, the borrower gets to take advantage of an initial interest rate that is lower than the fixed rate, with the potential for a falling interest rate in the future, at the risk that rates will rise rather than fall. From a credit underwriting perspective, FRMs have always outperformed one-year ARMs by a wide margin, precisely because payment stability always reduces risk. The trouble for a lot of borrowers was that increasing numbers of them didn’t feel the need for 30 years’ worth of interest rate protection, as the average tenure in a home became around 7 years, while occasionally shocking spikes in short-term rates meant that a one-year ARM was too often not enough rate protection. So the hybrid offered the middle way: enough rate protection to more or less match expected loan life, a start rate that was discounted less than a one-year ARM but was still cheaper than a fixed rate, plus the security of not being forced to refinance at the end of the fixed period if things didn’t go as planned and you were still in the home you bought—the other then-popular alternative to the ARM was the fixed-rate balloon, which had a term of five or seven years and then required a lump-sum payment of the remaining balance. With a balloon, you have to either refinance or sell at maturity, and take the refinance costs and potentially much higher market interest rate. A hybrid ARM, on the other hand, just turns into a one-year ARM after the first adjustment, which may not be what you wanted, but it doesn’t force you to do something by its very structure. Whether you are forced by affordability issues is, of course, another matter.
The immediate question these products raised for lenders was how to underwrite them: are they ARMs or FRMs for purposes of determining credit risk? The position taken by the GSEs from the beginning—and also adopted by the mortgage insurers—was that you could treat a hybrid as a FRM for underwriting purposes if its initial fixed period was longer than three years. If it was three years or less, the loan had to be treated as you would a one-year ARM. And that, by the way, meant qualifying the borrower at (usually) the maximum first adjustment rate: if your start rate was 5.00% and the first adjustment cap was 2.00%, then 7.00% was the maximum rate you would face at your first adjustment and thus the rate used to qualify you. The mortgage insurers used the more expensive ARM premiums for these loans, and allowed those with 5-year or greater fixed periods to use FRM premiums. All of this made perfect sense to Tanta at the time, by the way, and still does. All other credit practices being equal, true hybrids (fixed period of 5 years or more) very slightly underperform FRMs, but only by a hair. The 3/1 has always performed only very slightly better than the one-year ARM. Historically speaking, it’s not a dumb place to make the cut.
Then, of course, we had to get creative, adding interest-only periods to the initial fixed rate period, which creates enormous payment shock when and if the loan does reset; moving from a more-or-less standard 5/1 ARM with a 2.00% first adjustment cap to a more-or-less standard 5/1 ARM with a 5.00% first adjustment cap (so that the initial rate could be more reasonably discounted from the fixed, creating the classic “teaser” problem), changing the adjustments from one-year indexed to the treasury to 6-month indexed to the LIBOR, and, worst of all, deciding that the “hybrid” was the perfect product for subprime borrowers. When hybrids hit the subprime market, they not surprisingly mutated a bit, the initial fixed period on the majority of loans shrinking to 2 years with a 6-month reset, often with interest only for two years and a deeply-discounted start rate. This made the “subprime hybrid” an even worse performer than the old one-year “true ARM,” but certain folks continued to delude themselves (and their investors) that the “hybridization” of these products actually improved the risk characteristics, never mind that the loan was less a cross between a FRM and an ARM than it was a high-risk ARM with a single drop of FRM in it two generations ago.
Then there is the “teaser rate” problem. There is no exact or absolute definition of a “teaser” rate. The concept was traditionally applied to a start rate that was so deeply discounted relative to the fully-indexed rate (index plus margin) that its clear purpose was merely to rope in the borrower, and which had a pretty fair chance of creating severe payment shock down the road. The problem is, of course, that almost all ARMs—hybrid or not—are “discounted” relative to something (either the fully-indexed rate or the prevailing 30-year fixed rate). And there’s absolutely nothing wrong with that; in fact, if you the borrower are willing to take the future risks involved in an ARM, you’re getting screwed if your lender doesn’t give up a little yield in the here and now in exchange. The whole reason that the 7/1 and 10/1 ARMs go in and out of fashion isn’t that people wouldn’t like to have them sometimes, it’s that in certain rate environments it’s hard to price them with any real discount to the 30-year fixed, and why take one if you don’t get a rate discount? The point here is that conflating the terms “teaser” and “discounted start rate” is a big problem if you’re talking about regulations designed to combat the use of teaser rates, since if you outlaw any discount of the start rate you just basically increased the credit costs to prime borrowers for whom a 5/1 ARM with reasonable caps is often a great deal.
Of course, you can try to come up with some formula to define the difference between “teaser” and “discounted,” but you’re likely to fall into the silly pit that a lot of regulations have ended up falling into when they do things like this. The better approach—and for once, some regulators seem to have tried it—is not to focus on what makes a rate a “teaser,” but to focus on what makes a teaser a problem: how to calculate the payment used to qualify the borrower for the loan. The idea, in short, is that you can give the borrower any old rate discount you want, as long as you ensure that the borrower can afford the inevitable payment increase when the discounted rate goes away. Here, however, we run into the problem of deciding what is a reasonable time period over which to force the borrower to qualify at his or her current income, and that gets us back to the distinction between the “true” hybrids and the ARMs masquerading as hybrids. It is not obvious to me, at least, that prudence always and everywhere requires a mortgage borrower to qualify for the worst possible mortgage payment she might face in five years while assuming that her income will never increase. It does, however, strike me as prudent that a mortgage borrower should be able to carry the worst possible payment she might face in three years at her current income. Arbitrary? Sure, but you really do need to make a cut somewhere, unless you want to de facto eliminate the true hybrid ARM offering for prime (or even near-prime) borrowers, and why would you want to do that?
So this is why I’m so frustrated about all this noise regarding whether the 2/28 should “count” in the Nontraditional Mortgage Guidance or not. To give the lender lobby its due credit for a minute, they aren’t being as hysterical as they might sound by objecting to any regulation that codifies any and all “hybrid ARMs” as a problem product by definition. In my view, what the Nontraditional Guidance needs to do is just declare a set of rules for when a hybrid is an ARM-hybrid and when it’s a FRM-hybrid, require all ARM-hybrids to be qualified at the maximum interest rate possible at the start of the fourth year of the loan, and require lenders who offer interest-only ARMs to either offer the IO period for at least three years longer than the initial fixed period or qualify the borrower at the amortizing payment. (Going out three years past the adjustment means that you smooth out the payment increases, letting the rate rise over time to fully-indexed before you add in the recast to amortizing payments. The recast can still hurt, but by now you’re six to ten years into the loan, and chances are still reasonable that appreciation and income growth will bail you out if a refi won’t.) Beyond that, simply requiring lenders to chose either a prepayment penalty or a subprime credit score, but not both, would solve most of the 2/28 problem. (Why? Because you can’t afford to give that “teaser” rate to the borrower without throwing in a prepayment penalty to keep the loan from paying off before it adjusts, thereby increasing your expected yield over the life of the loan. If the investor didn’t get the prepayment penalty, the investor would require a more reasonable yield in the first two years.)
The rest of the problem can be solved most practically, in my mind, by mandating risk “classifications” for things like interest only, negative amortization, CLTVs over 90%, 5% first adjustment caps for the 5/1 ARM, stated income, etc. “Classifications” mean that a loan portfolio has to set aside higher loss reserves for loans in certain classes than for others; this costs the portfolio some yield, effectively putting a disincentive to risky lending in front of an institution that can’t afford decent reserves, while letting an institution that is strong enough offer a reasonable number of higher-risk loans. After all, it isn’t just borrowers whose income, stated or verified, can be a bit iffy. I’m all in favor of making the bank verify rather than state its income, and qualify for its loan portfolio based on its actual equity position, collateral quality, and generally responsible debt management behavior. But I’m old-fashioned enough to think that corporations shouldn’t necessarily get a better deal than consumers get.
MarketWatch: "Housing to Stabilize in '07"
by Calculated Risk on 12/21/2006 01:27:00 AM
From MarketWatch: Housing market got buffeted in 2006, expected to stabilize in 2007
... unlike some people had expected, the switch didn't follow the deafening "pop" of a massive real estate bubble.And there is plenty more "don't worry, be happy" talk in the story. But the problem with the story line is the bust was worse than most observers expected:
...the correction wasn't as harsh as some had feared. In fact, the year as a whole might even have been described as "healthy" if the country's perspective hadn't been skewed by the boom of the past few years, said John McIlwain, senior fellow for housing at the Urban Land Institute. The market is still "well within long-term norms," he said.
"I think the story of the year is the bubble that wasn't," McIlwain said. "Instead of a bubble busting, so far it has been a healthy correction."
"The housing market, as you know, it has been hit, I think, harder than most of us had expected."
Edward Lazear, Q&A Nov 21, 2006, chairman of the White House's Council of Economic Advisers
"I guess we are a bit surprised at how fast this has unraveled," said [Tom Zimmerman, head of ABS research for UBS]. Nov 22, 2006 on Subprime mortgages.
"Fifteen percent is pretty much in the bag for Orange County in 2006," [Gary Watts] says. "It's impossible for prices to go down this year."Note that year-over-year prices in Orange County were flat in the most recent survey, and will probably be down for the year.
Gary Watts,Feb, 2006, Orange County Broker
I'm not sure who expected housing to "pop" in 2006. The author doesn't quote anyone.
However, housing "bubbles" typically do not "pop", rather prices deflate slowly in real terms, over several years. As I've noted before, real estate prices display strong persistence and are sticky downward. Sellers tend to want a price close to recent sales in their neighborhood, and buyers, sensing prices are declining, will wait for even lower prices.
This means real estate markets do not clear immediately, and what we usually observe first is a drop in transaction volumes. That is what happened in 2006. And that is about what I predicted:
In my opinion, the Housing Bubble was the top economic story of 2005, but I expect the slowdown to be a form of Chinese water torture. Sales for both existing and new homes will probably fall next year from the records set in 2005. And median prices will probably increase slightly, with declines in the more "heated markets".Now comes 2007, and I expect falling prices, falling transactions, falling starts, falling housing related employment, falling home equity extraction - lots of falling - but not everything will be falling: foreclosures will be rising.
I wonder how this writer will characterize the surprises of 2007?
FedEX Outlook
by Calculated Risk on 12/21/2006 12:58:00 AM
From AP: FedEx 3Q Outlook Overshadows 2Q Earnings
... the company said it expected lower third-quarter earnings than last year, largely due to a sluggish U.S. economy and fuel bills.But international markets are doing well:
...
"We believe FedEx is beginning to see the impact of a slowing economy and as such, management is tempering expectations for the second half of the year," analyst Art Hatfield said in a report for Morgan Keegan.
"They said themselves that the domestic economy is showing signs of weakness," Broughton said. "FedEx's international business continues to grow and in a down-volume domestic environment, they produced the best operating margins they've ever produced."
...
In a conference call with analysts, FedEx founder and chief executive Frederick W. Smith said FedEx expects "steady performance" for the fiscal year ending May 31 largely because of a "healthy global economy led by continued strong growth in Asia."
But Smith also acknowledged he expects a "somewhat slower growth in the U.S. economy related to adjustments in housing and manufacturing sectors."
Wednesday, December 20, 2006
NAR: Concerned Over Foreclosures
by Calculated Risk on 12/20/2006 12:24:00 AM
The National Association of Realtors (NAR) joined with the Center for Responsible Lending (CRL) expressing concern about foreclosure rates: NAR Concerned Over Rapid Increase in Foreclosure Rates.
See CRL Report: 2.2 Million Subprime Borrowers Face Foreclosure
From NAR:
The National Association of Realtors(R) said it is concerned over the rising rate of defaults and foreclosures occurring in many areas around the country, and many Realtors(R) believe that some families don't understand the risks of taking out "exotic" mortgages.
In a conference call today with the Center for Responsible Lending and the Leadership Conference on Civil Rights, NAR President Pat Vredevoogd Combs urged consumers to make sure they understand the risks and rewards of all types of mortgages before they make a decision on a loan. ...
Foreclosures are not only a disaster for families but also for communities. Problematic loans are often made in concentrated areas, and high foreclosure rates of single-family homes can seriously threaten a neighborhood's stability and a community's well being. "Foreclosures can lead to high vacancy rates, which in turn, can cause all homes in the neighborhood to lose value," said Combs.
MBA: Mortgage Applications Decrease
by Calculated Risk on 12/20/2006 12:10:00 AM
The Mortgage Bankers Association (MBA) reports: Mortgage Applications Decrease in This Week’s Survey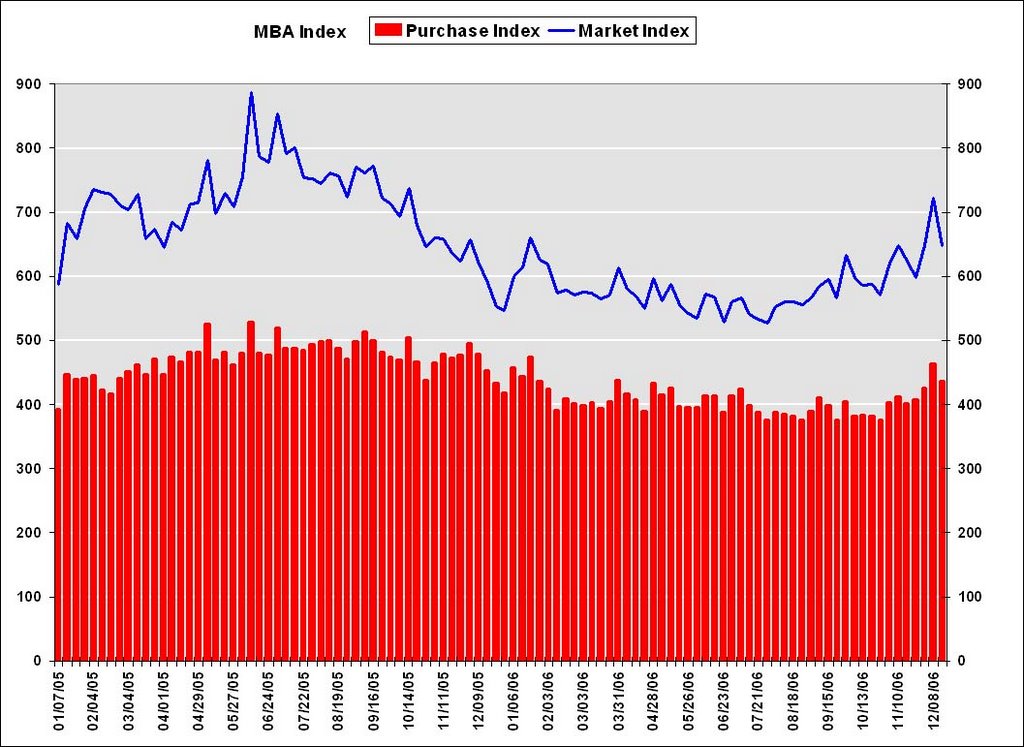 Click on graph for larger image.
The Market Composite Index, a measure of mortgage loan application volume, was 647.6, a decrease of 10.2 percent on a seasonally adjusted basis from 721.2 one week earlier. On an unadjusted basis, the Index decreased 11.6 percent compared with the previous week and was up 13.9 percent compared with the same week one year earlier.Mortgage rates increased:
The seasonally adjusted Refinance Index decreased by 14.6 percent to 1968.8 from 2304.4 the previous week and the Purchase Index decreased by 5.9 percent to 436.5 from 463.8 one week earlier.
The average contract interest rate for 30-year fixed-rate mortgages increased to 6.10 from 6.02 percent ...
The average contract interest rate for one-year ARMs increased to 5.82 percent from 5.76 ...
 The second graph shows the Purchase Index and the 4 and 12 week moving averages since January 2002. The four week moving average is up 2.1 percent to 433.4 from 424.6 for the Purchase Index.
The refinance share of mortgage activity decreased to 50.8 percent of total applications from 52.6 percent the previous week. The adjustable-rate mortgage (ARM) share of activity decreased to 23.6 from 24.9 percent of total applications from the previous week. The ARM share is at its lowest level since October 2003.Last week Bank of America commented on the recent surge in refinance activity:
"Strong MBA application activity ... We think its just bringing forward ’07 refi’s and see little help for riskier credits."
Tuesday, December 19, 2006
Report: 2.2 Million Subprime Borrowers Face Foreclosure
by Calculated Risk on 12/19/2006 04:54:00 PM
The Center for Responsible Lending has released a new report: Losing Ground: Foreclosures in the Subprime Market and Their Cost to Homeowners.
"... foreclosure rates will increase significantly in many markets as housing appreciation slows or reverses. As a result, we project that 2.2 million borrowers will lose their homes ...
...
We project that one out of five (19 percent) subprime mortgages originated during the past two years will end in foreclosure. This rate is nearly double the projected rate of subprime loans made in 2002, and it exceeds the worst foreclosure experience in the modern mortgage market, which occurred during the “Oil Patch” disaster of the 1980s."
Housing: Starts and Completions
by Calculated Risk on 12/19/2006 08:35:00 AM
The Census Bureau reports on housing Permits, Starts and Completions. Permits are still falling:
Privately-owned housing units authorized by building permits in November were at a seasonally adjusted annual rate of 1,506,000. This is 3.0 percent below the revised October rate of 1,553,000 and is 31.3 percent below the November 2005 estimate of 2,191,000.Starts rebounded:
Privately-owned housing starts in November were at a seasonally adjusted annual rate of 1,588,000. This is 6.7 percent above the revised October estimate of 1,488,000, but is 25.5 percent below the November 2005 rate of 2,131,000.And Completions are falling, but still just below record levels:
Privately-owned housing completions in November were at a seasonally adjusted annual rate of 1,915,000. This is 0.2 percent below the revised October estimate of 1,919,000, but is 0.3 percent above the November 2005 rate of 1,909,000.
 Click on graph for larger image.
The first graph shows Starts vs. Completions.
Starts have fallen "off a cliff", but completions have just started to fall.
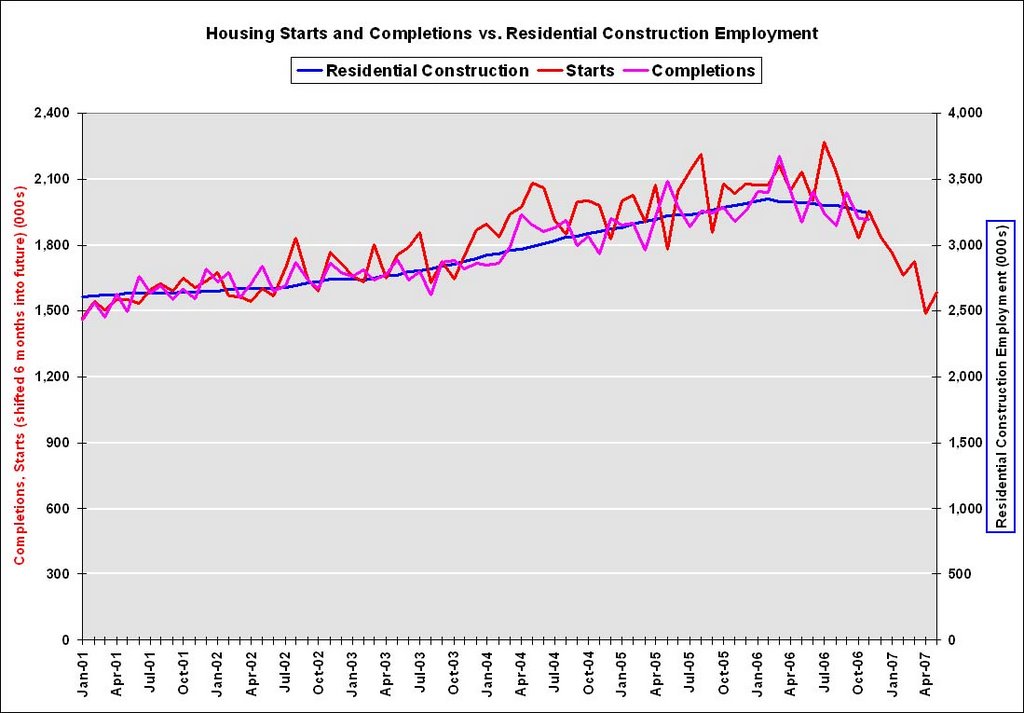
This graph shows starts, completions and residential construction employment. (starts are shifted 6 months into the future). Completions and residential construction employment are highly correlated, and Completions lag Starts by about 6 months.
Based on historical correlations, it is reasonable to expect Completions and residential construction employment to follow Starts "off the cliff". This would indicate the loss of 400K to 600K residential construction employment jobs over the next 6 months.


