 RSS Feed
 by Calculated Risk on 10/11/2006 04:46:00 PM
Wednesday, October 11, 2006
Pimco on Housing and Economy
On Bloomberg Video: Gross of Pimco Says Oil's Drop May Cut Demand for Risky Bonds.
Click image for video.
October 11 (Bloomberg) -- Bill Gross, manager of the world's biggest bond fund at Pacific Investment Management, and Paul McCulley, managing director, talked with Bloomberg's Brian Sullivan in Newport Beach, California, yesterday about prospects for a U.S. economic recession, the outlook for the U.S. housing market and Federal Reserve monetary policy, and the impact of falling oil prices on the demand for assets such as corporate and emerging-market debt.(Source: Bloomberg)
Bill Gross on housing prices:

"I don't think the Fed can afford to see the U.S. housing market nationally decline by more than 5%, or perhaps at an extreme, 10%. We've never had those types of declines and you don't want to replicate the Japanese experience of the 1990s. Admittedly that was commercial real estate. But a Real Estate bubble unwinding is a dangerous bubble unwinding, and we don't want to see anything more than minor negatives in terms of prices."Excerpt from Bill Gross on events that would make him change his view for next year:
"We could see stronger growth, as reflected in a housing market that levels off and maybe even comes back; stranger things have happened. That would be a scenario that would certainly flip-flop how we see things happening.
The second scenario would obviously be weaker growth - housing market decimating the real economy, not just as reflected in housing starts and the like, and housing employment, but in consumption and mortgage equitization and those types of things. That's the big question mark and no one really knows. Every economist on Wall Street, every Fed researcher, is trying to analyze exactly what this means for the consumer. We're just going have to find out."
FOMC Minutes on Housing
by Calculated Risk on 10/11/2006 02:12:00 PM
The Federal Reserve released the minutes of the FOMC meeting of September 20th: Minutes of the Federal Open Market Committee. Here are their comments on housing, starting with an overview:
Residential construction activity continued to contract in recent months. Single-family starts fell further in July and August to a level well below the peak in the third quarter of 2005. Construction in the multifamily sector also fell back. Sales of both new and existing single-family homes fell in July and were significantly below the peaks of last summer. A range of indicators suggested that housing market activity was likely to slow further in the near term. Pending home sales dropped noticeably in July, and mortgage rates had increased since the beginning of the year. Available measures suggested that prices of existing homes increased through the second quarter at a much lower rate than the one observed during the same period last year.And looking forward, they see a perfect soft landing:
In their discussion of the economic situation and outlook, meeting participants noted that the pace of the expansion appeared to be continuing to moderate in the third quarter. In particular, activity in the housing market seemed to be cooling considerably, which would contribute to relatively subdued growth over the balance of the year. Growth was likely to strengthen next year as the housing correction abated, with activity also encouraged by the recent decline in energy prices and still-supportive financial conditions. In the view of many participants, economic expansion would probably track close to the rate of growth of the economy's potential next year and in 2008.But some participants clearly expressed more concern about the impact of the housing bust during the discussion:
In their discussion of major sectors of the economy, meeting participants focused especially on developments in the housing market. Although the situation varied somewhat across the nation, housing activity was continuing to contract in most regions. Home sales had slowed considerably, and anecdotal reports suggested that more buyers were canceling contracts for purchases. Participants noted that inventories of unsold homes had climbed sharply in many areas and that builders were taking a number of measures to reduce inventories. Both permits for new construction and housing starts had declined significantly. Available measures of home prices suggested that appreciation had slowed considerably but prices in most areas were not falling, although some sellers were reported to be providing various inducements to potential purchasers that reduced effective prices.
Thus far, the drop in housing market activity appeared not to have spilled over significantly to other sectors of the economy.
... considerable uncertainty was expressed regarding the ultimate extent of the downturn in the housing sector and the degree to which the slowing in housing activity and the deceleration in home prices would affect consumption and other expenditures going forward.
MBA: Mortgage Applications Decrease
by Calculated Risk on 10/11/2006 12:26:00 AM
The Mortgage Bankers Association (MBA) reports: Mortgage Applications Decrease Click on graph for larger image.
The Market Composite Index, a measure of mortgage loan application volume, was 599.1, a decrease of 5.5 percent on a seasonally adjusted basis from 633.9 one week earlier. On an unadjusted basis, the Index decreased 5.3 percent compared with the previous week and was down 13.3 percent compared with the same week one year earlier.Mortgage rates increased slightly:
The seasonally-adjusted Refinance Index decreased by 5.8 percent to 1857 from 1970.8 the previous week and the Purchase Index decreased by 5.3 percent to 383.3 from 404.6 one week earlier.
The average contract interest rate for 30-year fixed-rate mortgages increased to 6.27 percent from 6.24 percent ...
The average contract interest rate for one-year ARMs increased to 5.88 percent from 5.86 percent ...

This second graph shows the Purchase Index and the 4 and 12 week moving averages since January 2002.
This is the first week of loan activity after the New Nontraditional Mortgage Guidance was released. It will be interesting to see if the guidance has any impact on applications over the next few weeks.
Monday, October 09, 2006
Housing Prediction: Starts, Completions, Sales
by Calculated Risk on 10/09/2006 12:37:00 PM
No one has a crystal ball, but last week Fed Vice Chairman Kohn and former Fed Chairman Greenspan made predictions on the housing market. From Dr. Kohn on Housing Starts:
"... any overbuilding in 2004 and 2005 was small enough to be worked off over coming quarters at close to the current level of housing starts."And from Dr. Greenspan:
... the "worst may well be over" for the U.S. housing industry that's suffering its worst downturn in more than a decade.In the previous post I estimated that overbuilding might have added close to 1.4 million housing units over the last few years. In this post I will estimate the impact on Housing Starts, Completions and New Home Sales. All caveats apply!
The level of completions needed is obviously dependent on the units needed, the amount of recent overbuilding, and the period over which the excess supply is absorbed. Using the Brookings forecasts, and removing mobile homes, we can estimate the U.S. will need about 1.7 million new housing units per year for the next 3 years, before subtracting the impact of recent overbuilding. Then using the 1.4 million estimate of excess supply from the previous post, and working the excess off over 3 years, this gives completions of approximately 1.2 million per year for the next 3 years.
 Click on graph for larger image.
This graph shows U.S. completions and starts for the last 40 years (from Census Bureau).
Obviously completions follow starts. Although starts have recently fallen significantly, completions have only just started to decline. It appears builders are still completing too many housing units, and the result is rising inventories of unsold homes. Note that reported inventories have stabilized, but that the Census Bureau does not include cancellations in inventory (see this post), so inventory levels are probably significantly higher than reported.
Although I estimate completions might fall to 1.2 million units per year over the next few years, starts might fall even further at first - perhaps to 1.1 million unit rate (SAAR) or lower until builders start seeing conditions stabilize. This is the typical pattern - starts fall to a lower level than completions as builders react to changing market conditions.
What does this mean for New Home Sales?
 This graph shows the reason new housing units were added.
The Green columns are completed new housing units intended for rentals. Blue are homes built directly for the owner and Red are homes built for sale.
The number of units built to rent will probably increase over the next few years, and the homes built for owners might decrease, but most of the decline in starts and completions will come from housing units built for sale.
 Some simple addition ... If 600 thousand units are built as apartments or for owners each year, and completions fall to 1.2 million units - that gives 600 thousand housing units built for sale. Since builders will also be working off their inventories, New Home Sales might fall to 800 thousand per year or less - until the excess inventory is absorbed.
Perhaps some of these estimates are too high (or too low), but I think Drs. Kohn and Greenspan are overly optimistic. My view is the housing bust has just started.
Sunday, October 08, 2006
Housing: Estimate of Recent Overbuilding
by Calculated Risk on 10/08/2006 07:44:00 PM
Fed Vice Chairman Donald L. Kohn said this week:
"... any overbuilding in 2004 and 2005 was small enough to be worked off over coming quarters at close to the current level of housing starts."Here are a couple of estimate of the amount of overbuilding in recent years:
 Click on graph for larger image.
This graph is based on estimates from the Brookings Institution: Toward a new Metropolis: The opportunity to rebuild America (hat tip: JLA)
Blue is the estimate of new housing units needed per year from Brookings. This includes new household formation and replacing existing stock (due to demolitions, etc.) Red is the actual number of housing units added to inventory in recent years. The cumulative excess is 1.42 million housing units through 2005.
There is additional overbuilding in 2006 that is not included.
Another approach, to estimate the amount of overbuilding, would be to use the Census Bureau data on the housing inventory and vacancy rates. If vacancy rates fell back to 2000 levels that would mean there are 1.1 million excess units. Add to this the current excess New Home inventory and any second homes that are being held as investments, and the number would be close to the 1.4 million estimate using the Brookings data.
In the next post, I will look at the impact of this overbuilding on starts and New Home sales.
Homebuilder Hovnanian to cut jobs
by Calculated Risk on 10/08/2006 12:25:00 AM
From the Star Ledger: Housing slide prompts Hovnanian to cut jobs
In an internal memo to employees dated Oct. 3, Chief Executive Ara K. Hovnanian said an unspecified number of staff reductions were necessary in order "to remain healthy," as the nation's eighth-largest U.S. home builder grapples with the broad downturn plaguing its industry.Paper-money has posted the Hovnanian internal memo:

MEMORANDUM TO: All Associates
FROM: Ara K. Hovnanian
DATE: October 3, 2006
A few months ago I wrote to you about the changing market conditions in our industry and our concerns about how long the downturn in homebuilding may last. Since that time, the market has slowed further still, representing one of the steepest declines in new home sales in our memory. Most of our markets have been affected, some severely. At this point, we are preparing for a long period of slower sales, at least through 2007 and perhaps beyond.
...
The most difficult adjustment we have had to make to the changing market is in the area of staffing. In many locations, including corporate headquarters, we have been forced to face the fact that we no longer have enough work for all of our Associates. ...
emphasis added
Friday, October 06, 2006
Greenspan: Worst may be over for Housing
by Calculated Risk on 10/06/2006 06:08:00 PM
Bloomberg reports: 
Former Federal Reserve Chairman Alan Greenspan said the "worst may well be over" for the U.S. housing industry that's suffering its worst downturn in more than a decade.The graph shows the MBA Purchase Index since it's inception in 1990. On a long term scale, I don't see any significant "flattening out".
Greenspan, speaking at a conference in Calgary today, pointed to a "flattening out" of weekly mortgage applications after they went down "very dramatically."
Housing: Demolitions and Other Losses
by Calculated Risk on 10/06/2006 02:43:00 PM
UPDATE: This is part of a series, and there were several important caveats in the first post. From the first post, Demographics and Housing Demand
I'm trying to answer one of the key housing questions: How far will New Home sales fall? This is a complicated question and, of course, the quantity demanded depends on the price - and homebuilders are already responding to the sluggish market by lowering their prices and / or offering incentives. So how quickly prices fall is a key determinate on how far New Home Sales decline.This post:
... This is a look at the national market. Note that demographic drivers in local markets will differ considerable from the national trends. As an example the population in Detroit is declining, and since housing is very durable, prices for existing homes are below replacement costs.
In the previous post, based on current demographics, I calculated that the U.S. housing stock would need to increase by 1.2 million units per year - all else being equal. A couple of people noted that the number of new units needed would then be 1.2 million plus the number of units lost each year (through demolition or other losses).
In the comments, mort-fin recommended a paper by Eggers & Moumen: Components of Inventory Change: 2001-2003. From their paper:
 Click on figure for larger image.
 In the context of Figure 1, the Census Bureau provides estimates for both rectangles (the 2001 and 2003 housing stocks) and one oval (units added through new construction between 2001 and 2003). No one estimates the other three ovals: the number of units that belong to both the 2001 and 2003 housing stock, units lost to the housing stock between 2001 and 2003, and other additions to the housing stock between 2001 and 2003.The paper has a detailed analysis of the housing market from 2001 to 2003. A fairly large number of housing units are taken out of service each year (mobile homes moved, units changed to nonresidential use, etc.) and a similarly large number is added back in each year (changed to residential use, returned to service after temporary loss, etc.).
While losses and other additions are small relative to the overall stock, they encompass important features of how housing markets evolve. ... Losses can be either permanent or temporary. Units destroyed by natural disasters or intentionally demolished are permanent losses. Temporary losses include units that are merged into other units or units that are used for nonresidential purposes. Additions can include units resulting from splitting up larger units, mobile home move-ins, and units that had been used formerly for nonresidential purposes.
Demolitions
The number of units lost to demolitions and disasters, from 2001 to 2003, was 382,000, or about 191,000 per year.
However there is a basic problem applying this analysis to the current market. Many demolitions and temporary losses are voluntary and are dependent on market conditions.
As an example there have been 8 units demolished on my block during the last four years. All of these units have been replaced, or are in the process of being replaced, with new construction. A similar construction boom occurred during the late '80s, but not a single unit was demolished and replaced during the previous housing bust from 1990 to 1996.
During boom times, many more units are removed from stock by demolitions temporarily reducing the overall housing stock. This actually puts some upwards price pressure on homes!
Back to my block: there were an additional four units scheduled for demolition this year. The builders have put off their plans and are now leasing out the existing properties. Note: Yes, it feels like I live in a construction zone. Welcome to a Southern California beach community during a housing boom.
I suspect this is happening everywhere; small builders are delaying projects if they don't already have a shovel in the ground. So the number of demolitions over the next couple of years will probably be substantially below the levels of the last few years (and below the 2001 to 2003 period in the Eggers & Moumen study).
So a demographics analysis would suggest 1.2 million new units are needed per year. During the 2001 to 2003 period, an additional 190 thousand new units were needed per year due to demolitions - but that number will be lower during the bust. Also, the 1.2 million figure is reduced by the number of new mobile homes added each year (147K according to Bill Conerly in the comments to the previous post).
So maybe an estimate of 1.4 million units per year would be generous. This number would then be reduced by the overhang of excessive building of the last few years. More to come ...
September Employment Report
by Calculated Risk on 10/06/2006 10:17:00 AM
The BLS reports: U.S. nonfarm payrolls climbed by 51,000 in September, after a revised 188,000 gain in August, and the unemployment rate fell slightly to 4.6% in September from 4.7% in August.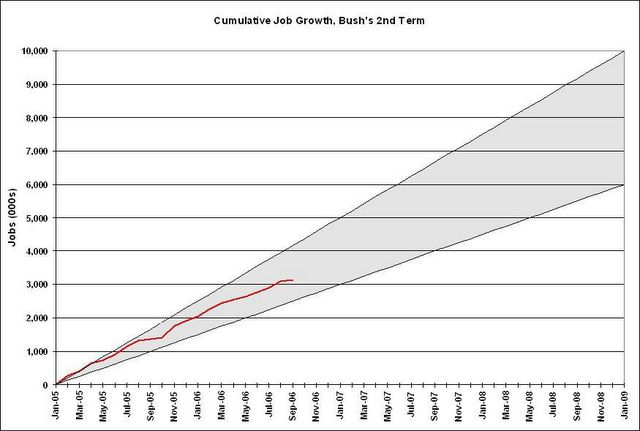 Click on graph for larger image.
Here is the cumulative nonfarm job growth for Bush's 2nd term. The gray area represents the expected job growth (from 6 million to 10 million jobs over the four year term). Job growth is about in the middle of the expected range.
The following two graphs are the areas I've been watching closely: residential construction and retail employment.
Residential construction employment decreased by 15,100 jobs in September and is down 54.1 thousand, or about 1.6%, from the peak in February. This is the beginning of the loss of several hundred thousand residential construction jobs over the next year or so.
Note the scale doesn't start from zero: this is to better show the change in employment.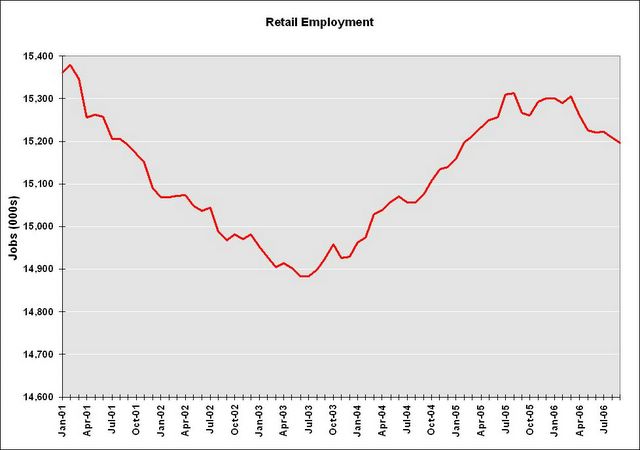
Retail employment declined 11,900 jobs in September. The YoY change in retail employment is now -0.5%.
The YoY decrease in retail employment is concerning: see Retail Employment
It appears the expected job losses in residential construction employment has started. I expect the rate of losses to pick up in the coming months. Overall, the upwards revision to the August report offset the weak September report.
Thursday, October 05, 2006
Fed's Kohn on Housing
by Calculated Risk on 10/05/2006 02:13:00 PM
Fed Vice Chairman Donald L. Kohn spoke yesterday on the U.S. Economic Outlook. Kohn made several comments regarding housing that are worth reviewing. I'm going to jump around, so please read the speech for his complete comments.
First, Dr. Kohn focused on housing starts as a metric to discuss the housing market. Click on graph for larger image.
Here is a graph of housing starts since Jan 1959; the beginning of the data series from the Census Bureau. From Dr. Kohn:
"From a trough of fewer than 1.5 million units at an annual rate during the recession of 2000, starts of new single-family and multifamily homes rose to a post-World War II high of 2.2 million units last year."Kohn's recent numbers are correct, but it might be interesting to understand why Kohn is wrong about previous periods. Demographics for housing were actually more favorable in the '70s and '80s than today.
 The second chart shows the trend of people per housing unit in the United States. The number of persons per unit was trending down until around 1990 and then flattened out. There was a rapid decrease in the '70s as the boomers started forming new households en masse. The reason for the record starts in the '70s was due mostly because of the shift in the number of people per housing unit. See the following table:
| Housing Added due to Population Growth and changes in Household Size | |||
| Decade | Due to Population Growth | Due to Change in Household Size | Total Housing Units Added |
| 1940s | 5.84 Million | 2.86 Million | 8.70 Million |
| 1950s | 9.11 | 3.08 | 12.19 |
| 1960s | 8.10 | 2.27 | 10.37 |
| 1970s | 9.05 | 10.65 | 19.70 |
| 1980s | 9.13 | 4.77 | 13.90 |
| 1990s | 13.47 | 0.13 | 13.60 |
| 2000s (through July '06) | 7.63 | 2.04 | 9.67 |
For more on Demographics see this post: Demographics and Housing Demand
More from Kohn:
"... calculations about the sustainable level of housing starts based on demographic factors, such as population growth and household formations, suggest that starts may be closer to their trough than to their peak."As Kohn noted, housing starts peaked at about 2.2 million units per year in 2005. Currently starts are at less than 1.7 million units; a decline of over 0.5 million units at an annualized start rate. So when Kohn says starts are probably closer to the "trough than to their peak", he doesn't think starts will fall to a 1.2 million unit rate.
Here is the math: The Census Bureau projects the population will grow by about 2.85 million people this year. There are approximately 2.4 people per household and this ratio is staying steady. So, all else being equal, the U.S. would need about 1.2 million units per year (edit: new starts would equal 1.2 million plus demolitions). I think Kohn might be optimistic on how far starts will fall, and this doesn't include any potential overhang from overbuilding in 2004 and 2005.
More from Kohn:
"... the fourth quarter of last year seems to provide a reasonable reference point: Since that time, housing starts have fallen about 20 percent, and home sales are down 10 percent. Home-price appreciation has also slowed dramatically since late last year, and some local markets have experienced outright price declines. Homebuilders report that cancellations have increased sharply, especially for second homes. Realtors note that existing houses are staying on the market longer, and sellers must increasingly make concessions to buyers."Reported New Home sales are off 18% from the Q4 2005 to the three most recent months. Existing Home sales are off about 12% from the peak of 2005. So I think Kohn is underestimating the decline in sales so far. And when cancellations are considered, the picture is even more bleak.
In the previous post I agreed with Kohn's assertion:
"To date there is little evidence that this correction in the housing market has had any significant adverse spillover effects on other parts of the economy."Yes, but so far there have been few BLS reported housing related job losses, and mortgage equity withdrawal (MEW) has been strong. Foreclosures have just started to rise (and rise quickly in some areas), and Kohn completely ignores any impact from the extensive use of nontraditional mortgages.
Kohn seems to be underestimating both the housing bust, underestimating the impact from the loss of jobs and MEW, and overestimating the positive demographics factors. In my view, this leads Kohn to underestimate the future impact of the housing bust on the general economy.

In Memoriam: Doris "Tanta" Dungey


| Privacy Policy |
| Copyright © 2007 - 2023 CR4RE LLC |