 RSS Feed
 by Calculated Risk on 9/30/2006 04:03:00 PM
Saturday, September 30, 2006
Housing Bust Impact: Office Leasing
From the Orange County Register: Office landlords vulnerable to housing woes
Orange County's office market is one of the most highly exposed markets in the nation to the housing industry, an industry report says.The #1 office market with exposure to the housing bust is the Inland Empire!
The county and Las Vegas tie for third among major markets that lease a high percentage of space to housing-related companies, says a study by Grubb & Ellisand PNC Real Estate Finance.
Housing companies accounted for 21 percent of all leasing activity in the county since 2000.
Yet in recent months, the trend shifted, brokers say.
Mortgage companies have vacated more than a million square feet of office space this year amid a drop in demand for home loans, brokers say. A slowing housing market and slightly higher interest rates are to blame, they say.
...
Housing-related companies include homebuilders, sellers of materials such as lumber, mortgage and other real estate finance firms, and professional firms such as architects.
Nationwide, the effect of the housing slowdown on the office market is likely to be modest, Grubb's report says.
Friday, September 29, 2006
New Home Sales and Cancellations
by Calculated Risk on 9/29/2006 06:00:00 PM
From Caroline Baum at Bloomberg: Think Housing's Stabilized? See Cancellations
... cancellations are rising, and they aren't being captured in the aggregate statistics because of the way the survey is designed. Hence, sales are being overstated and inventories understated.This is the clearest discussion I've seen about how the Census Bureau accounts for cancellations.
``Once a sales contract is signed, there's no way of recording the cancellation or putting the home back in inventory,'' says Dave Seiders, chief economist at the National Association of Homebuilders in Washington. ``Builders keep track of gross and net sales; we don't have a net sales number from Commerce.''
The Census Bureau, which is one of the Commerce Department's statistical agencies, counts an initial new home sale: Sales go up and the ``for sale'' inventory is reduced. If the sale is canceled, it isn't reflected in revisions to previous months. What happens? When the home is ``resold,'' statisticians ignore that transaction.
``We don't double count,'' says Steven Berman, the survey statistician for the residential branch of the Census Bureau's manufacturing and construction division.
When the cancellation rate is changing -- in either direction -- it can distort both sales and inventories.
We know from big builders that cancellation rates are rising. Seiders says the rate ``has roughly doubled over the last year'' and is ``more serious at the big companies.''
...
The effect of higher cancellations is ``to overstate the overall level of sales and understate the level of inventories,'' Carson says. The opposite is true at the bottom of the economic cycle, when sales pick up and the resold homes aren't registered as a sale or removed from the ``for sale'' pile.
What makes the current situation so worrisome is the ``unprecedented inventory overhang, encompassing new and existing markets and many of the largest metropolitan areas,'' Carson says. ``Its sheer size raises the odds that prices will fall more and longer nationwide than they did in the 1990s.''
1) When a house is sold, the Census Bureau includes the sale and reduces inventory by one.
2) If the house is cancelled, the Census Bureau does nothing. Sales are not reduced; inventory is not increased.
3) When the same house is resold, the Census Bureau does nothing. It is not included in Sales.
So if 100K houses have been cancelled and not resold, inventory is actually 100K higher than reported by the Census Bureau. Because of the recent high cancellations rates, this means that new home sales are probably much lower than reported by the Census Bureau - and inventories are significantly higher.
IRS introduces New Tool for Mortgage Income Verification
by Calculated Risk on 9/29/2006 02:38:00 PM
The Hartford Courant reports: Lenders Will Be Spotting Income Fibs Much Faster
Starting Monday, it's going to get much riskier to fib about your income when you apply for a home mortgage. That's because the Internal Revenue Service is overhauling a key income verification tool used by lenders - making it faster and easier to pull up electronically the confidential income tax information of borrowers.
...
Many lenders in recent years have offered "stated income" and other limited documentation mortgages aimed especially at self-employed applicants. Dubbed "liar loans" by industry critics, stated-income mortgage programs allow applicants to bypass standard underwriting requirements for W-2s or copies of personal and corporate income tax records.
Instead, applicants simply assure the loan officer or broker that, yes indeed, we earn enough to qualify for the mortgage, and the transaction proceeds to closing. Often lenders will ask borrowers to fill out what is known as an IRS Form 4506-T along with their other mortgage documents.
That form authorizes the lender or the investor providing the money for the mortgage to obtain transcripts from the IRS summarizing income and tax data for as many as four years. The form must be signed by the borrower and can be used only during the 60-day period after the date of signing.
Until now, the process of faxing in 4506-T requests to the IRS and obtaining transcripts has been paper-driven and non-electronic - making income verifications slow and difficult to fit into lenders' highly automated loan underwriting systems. Most lenders have used 4506-T forms as a way to perform quality-control checks on pools of closed mortgages.
But now, with the IRS promising to provide electronic transcript tax data within one to two business days in an electronic format, more lenders are likely to run income checks before closing - even on loans to applicants who are not self-employed or using stated-income programs.
Nontraditional Mortgage Guidance Released
by Calculated Risk on 9/29/2006 11:55:00 AM
From the Federal Reserve: Federal Financial Regulatory Agencies Issue Final Guidance on Nontraditional Mortgage Product Risks
The federal financial regulatory agencies today issued final guidance to address the risks posed by residential mortgage products that allow borrowers to defer repayment of principal and sometimes interest (Interagency Guidance on Nontraditional Mortgage Product Risks).Addendum
These products, referred to variously as "nontraditional," "alternative," or "exotic" mortgage loans (referred to below as nontraditional mortgage loans), include "interest-only" mortgages and "payment option" adjustable-rate mortgages. These products allow borrowers to exchange lower payments during an initial period for higher payments later.
While similar products have been available for many years, the number of institutions offering them has expanded rapidly. At the same time, these products are offered to a wider spectrum of borrowers who may not otherwise qualify for a similar-size mortgage under traditional terms and underwriting standards. The agencies are concerned that some borrowers may not fully understand the risks of these products. While many of these features exist in other adjustable-rate mortgage products, the agencies' concern is elevated with nontraditional products because of the lack of principal amortization and the potential for negative amortization. In addition, institutions are increasingly combining these loans with other features that may compound risk ("risk layering"). These features include making simultaneous second-lien mortgages and relying on reduced or no documentation in evaluating an applicant's creditworthiness.
The final guidance discusses the importance of carefully managing the potential heightened risk levels created by these loans. Toward that end, management should:Ensure that loan terms and underwriting standards are consistent with prudent lending practices, including consideration of a borrower's repayment capacity;The agencies published for comment proposed interagency guidance on Nontraditional Mortgage Products on December 29, 2005. Comments were received from financial institutions, trade associations, consumer and community organizations, state and financial regulatory organizations, and other members of the public. The agencies made a number of changes to the proposal to respond to the commenters' concerns and to provide additional clarity.
Recognize that many nontraditional mortgage loans, particularly when they have risk-layering features, are untested in a stressed environment. These products warrant strong risk management standards, capital levels commensurate with the risk, and an allowance for loan and lease losses that reflects the collectibility of the portfolio; and
Ensure that consumers have sufficient information to clearly understand loan terms and associated risks prior to making a product or payment choice.
NTM attachment 1 (104 KB PDF) (note: this is the guidance)
NTM attachment 2 (261 KB PDF)
Housing: Reports of Fraud Grow
by Calculated Risk on 9/29/2006 11:36:00 AM
David Streitfeld writes in the LA Times: More Home Buyers Stretch Truth, Budgets to Get Loans

Mortgage fraud continues to escalate in Southern California, FBI figures show, raising concerns of increased defaults and foreclosures as the housing market cools down."It's only when the tide goes out that you learn who's been swimming naked." Warren Buffett.
Lenders filed 4,228 reports of suspicious activity in the region during the first 11 months of the government's fiscal year, which ends Saturday, the FBI said. That puts 2006 on track to nearly double last year's total.
The jump in reports of suspicious activity even as home sales have declined may stem in part from a lag in reporting. But the FBI and industry experts say the trend also reflects growing deceit by average borrowers who overstated their income, exaggerated their assets or hid their debts simply to qualify for a mortgage in the region's sky-high housing market.
...
During the boom, people who lied about their income to get a loan — and then struggled to make the payments — had the option of making ends meet by tapping their newfound equity through refinancing or by selling the property for a profit.
But now, with prices flattening out or declining, those without sufficient equity could be forced to sell for a loss or even default on payments. That could accelerate any downturn in the market by swamping it with foreclosed and bargain-priced properties.
Thursday, September 28, 2006
UCLA on Housing
by Calculated Risk on 9/28/2006 01:58:00 PM
The LA Times reports: UCLA Group Predicts Flat Home Prices
... the UCLA Anderson Forecast reiterates earlier projections that the deteriorating housing sector will slow state and national economic output and job growth through 2008. Although it doesn't rule out a recession, it doesn't expect one.In summary, UCLA is forecasting five years of flat nominal home prices (15% to 20% real price decline) and GDP growth of 1.8% through the first half of '07.
...
"Expect home prices five years from now to be about the same as they are today, though lower in real [inflation-adjusted] terms by 15%-20%," the forecast said.
Although the statewide average price might not decline, a few areas where about 40% of the housing stock is new construction — such as in Yolo and Placer counties — are expected to see drops as builders cut prices to move inventory ...
... the lack of a significant price correction is bad for the economy overall because it will lead to further job and productivity losses in the housing sector, said Edward Leamer, director of the UCLA Anderson Forecast.
"So while your happy homeowner is pleased by the fact that home prices are not going down," Leamer said, "the unhappy home builder is not going to have anything to do."
Leamer cautioned that the outlook was based on data trumped by recent reports showing that housing sales and starts were sliding more rapidly than the group had projected.
If the trend accelerates, he said, "then our forecast is too optimistic."
...
It expects inflation-adjusted economic growth to slow to an average annualized rate of 1.8% through the first half of 2007 and unemployment, now at 4.7%, to rise to 5.1% by the end of next year.
...
"While not a recession, it is hardly a pretty picture," the UCLA report said. "The combination of sluggish growth and rising prices will have the look and feel of a low-level stagflation."
Wednesday, September 27, 2006
Dow Jones: Exotic Mortgage Guidance To Be 'Benign'
by Calculated Risk on 9/27/2006 06:56:00 PM
Dow Jones reports: US Government Exotic Mortgage Guidance To Be 'Benign' -Analysts
Federal bank and thrift regulators are close to releasing final guidelines on exotic mortgage products, but the agencies aren't expected to call for wholesale changes in the way these products are marketed or made, three analysts wrote Wednesday.
...
Those guidelines are expected to become final in the next few days.
"We view the...guidance as relatively benign and unlikely to materially impact the business models of option ARM lenders, namely Countrywide (CFC), Washington Mutual (WAMU), Downey Financial (DSL), and Indymac (NDE)," three analysts from Friedman Billings Ramsey wrote in an industry update. [emphasis added]
New Home Sales and Recessions
by Calculated Risk on 9/27/2006 04:35:00 PM
One of the most reliable economic leading indicators is New Home Sales. Click on graph for larger image.
New Home sales were falling prior to every recession of the last 35 years, with the exception of the business investment led recession of 2001. This should raise concerns about a possible consumer led recession in the months ahead.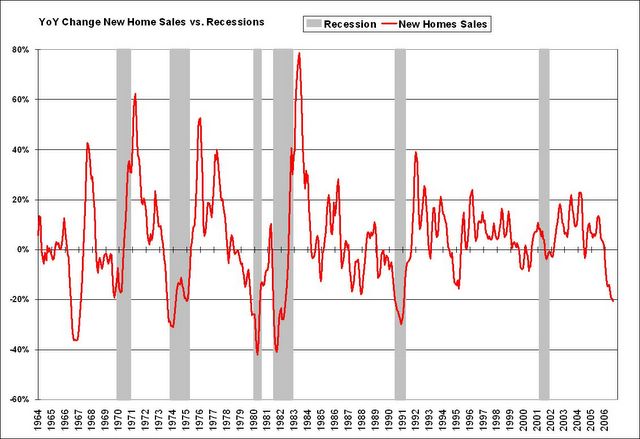
The second graph shows the YoY change in New Home Sales vs. Recessions. For a description of this graph, see: Investment and Recessions
With the New Home sales data released today, including downward revisions for the last few months, this indicator is at minus 20.6%, a level that has historically signaled a recession. The one exception was in the mid '60s when the buildup for the Vietnam war kept the economy out of recession.
One of the two best economic leading indicators is now flashing recession. The other reliable indicator is an inverted yield curve, and the yield is currently inverted.
More on August New Home Sales This graph shows August New Home sales for the last 20 years. The recent sharp drop in sales is similar to the decrease at the start of the 1990s housing bust.
August sales have fallen back to the 2002 levels.
And this graph shows YTD New Home sales through August. It now appears that 2006 will finish as the 4th best year behind 2003.
Given that sales have fallen back to 2002/2003 levels, it would seem reasonable to expect that BLS reported residential construction employment will fall back to the levels of those same years. The following chart shows BLS data for the last 6 years.
| Residential Construction Employment, Monthly Average, Thousands | |||
| Year | Residential building | Residential specialty trade contractors | Total |
| 2001 | 781 | 1849 | 2630 |
| 2002 | 803 | 1887 | 2690 |
| 2003 | 837 | 1965 | 2802 |
| 2004 | 896 | 2123 | 3019 |
| 2005 | 949 | 2278 | 3227 |
| 2006 | 979 | 2346 | 3325 |
There will probably be 600K jobs lost in reported residential construction employment over the next couple of years - if housing stabilizes at this level. If housing continues to fall, something I think is likely, then even more jobs will be lost.
New Home Sales Revisions
by Calculated Risk on 9/27/2006 02:52:00 PM
During periods of housing market weakness, the preliminary estimate of New Home Sales from the Census Bureau has consistently been too high.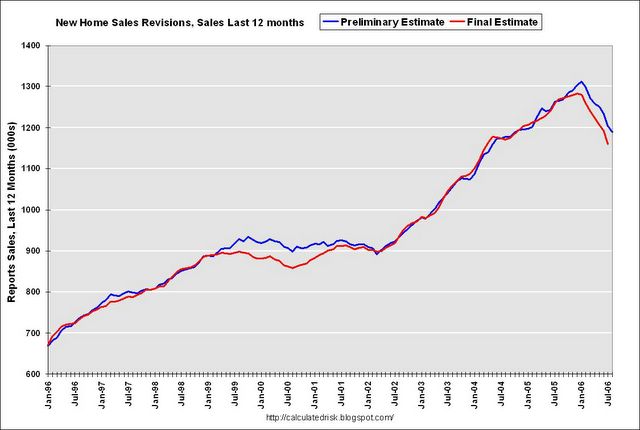 Click on graph for larger image.
This graph shows the previous 12 months of sales using the preliminary estimate and the final estimate - or most recent estimate for last few months, since final estimate isn't available yet.
NOTE: Graph start at 600 thousand units to better show the difference between the preliminary and final estimates.
During the period of flat sales in 2000 and 2001, the Census Bureau's preliminary estimate was too high. And during the current housing bust, the Bureau's preliminary estimates are once again being revised down.
Today's report was no different. The previous months were all revised down, and the odds are New Home Sales for August will be around or under 1 million units when the final estimate is released.
August New Home Sales: 1.050 Million Annual Rate
by Calculated Risk on 9/27/2006 09:57:00 AM
According to the Census Bureau report, New Home Sales in August were at a seasonally adjusted annual rate of 1.050 million. Sales for July were revised down to 1.009 million, from 1.072 million. Numbers for May and June were also revised down.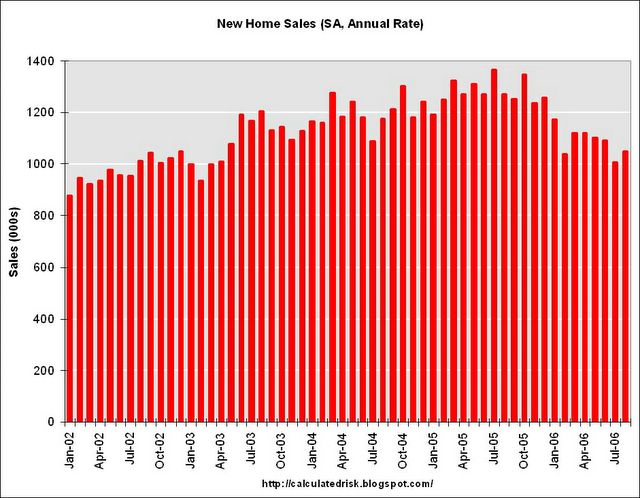
Click on Graph for larger image.
Sales of new one-family houses in August 2006 were at a seasonally adjusted annual rate of 1,050,000, ... This is 4.1 percent above the revised July rate of 1,009,000, but is 17.4 percent below the August 2005 estimate of 1,271,000.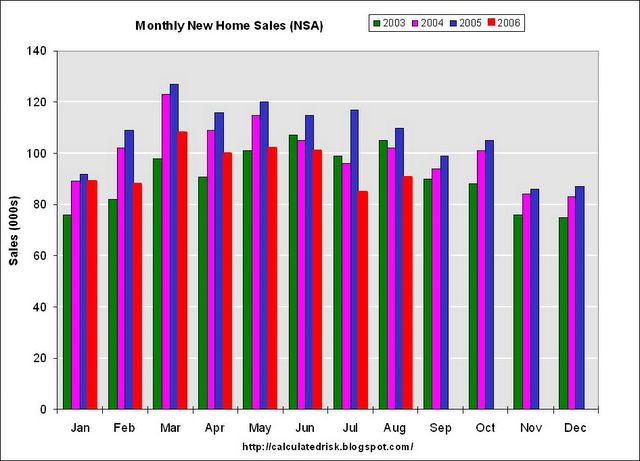
The Not Seasonally Adjusted monthly rate was 91,000 New Homes sold. There were 110,000 New Homes sold in August 2005.
On a year over year NSA basis, August 2006 sales were 17.3% lower than August 2005. Also, August '06 sales were below August 2004 (102,000) and August 2003 (105,000) sales. This is the lowest August since 2002 when 90,000 new homes were sold.
The median and average sales prices were down slightly. Caution should be used when analyzing monthly price changes since prices are heavily revised.
The median sales price of new houses sold in August 2006 was $237,000; the average sales price was $304,400.
The seasonally adjusted estimate of new houses for sale at the end of August was 568,000. This represents a supply of 6.6 months at the current sales rate.
The 568,000 units of inventory would have been another record for new houses for sale, except July 2006 was revised up to 570,000.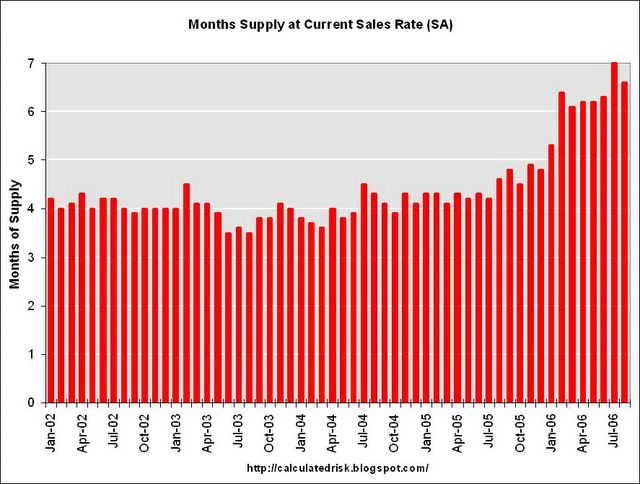
On a months of supply basis, inventory is above the level of recent years.
This report is very weak, especially considering the strong downward revisions for the previous months.
More later today on New Home Sales and Recessions.

In Memoriam: Doris "Tanta" Dungey


| Privacy Policy |
| Copyright © 2007 - 2023 CR4RE LLC |