 RSS Feed
 by Calculated Risk on 9/04/2006 06:27:00 PM
Monday, September 04, 2006
Demographics and Housing Demand
I'm trying to answer one of the key housing questions: How far will New Home sales fall? This is a complicated question and, of course, the quantity demanded depends on the price - and homebuilders are already responding to the sluggish market by lowering their prices and / or offering incentives. So how quickly prices fall is a key determinate on how far New Home Sales decline.
This post is more modest; this is an overview of some of the demographic drivers of housing demand. This is a look at the national market. Note that demographic drivers in local markets will differ considerable from the national trends. As an example the population in Detroit is declining, and since housing is very durable, prices for existing homes are below replacement costs. (See Profile of Edward L. Glaeser)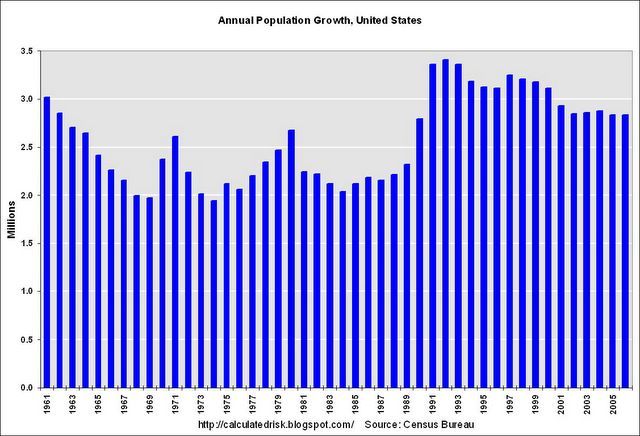 Click on graph for larger image.
The first key demographic for housing is population growth. This chart show the annual U.S. population growth according to the Census Bureau. The surge in the early '90s was probably a combination of the Baby Boom echo and perhaps immigration. But the key is that population growth is currently running about 2.85 million people per year. The second chart shows the trend of people per housing unit in the United States. The number of persons per unit was trending down until around 1990 and then flattened out. There was a rapid decrease in the '70s as the boomers started forming new households en masse.
Recently the number of people per housing unit has fallen slightly again. This could be due to people moving from renting to homeownership - leaving more vacant rental units. Another factor frequently cited by the National Association of Realtors is 2nd home purchases. A third possibility is speculative purchases.
Whatever the causes, changes in the ratio of people to housing units is a key driver for housing. In the '70s, there was more housing demand due to smaller household units, than due to the growth in the population. Conversely demand in the '90s was almost exclusively due to population growth, as household sizes stabilized. See the following table:
| Housing Added due to Population Growth and changes in Household Size | |||
| Decade | Due to Population Growth | Due to Change in Household Size | Total Housing Units Added |
| 1940s | 5.84 Million | 2.86 Million | 8.70 Million |
| 1950s | 9.11 | 3.08 | 12.19 |
| 1960s | 8.10 | 2.27 | 10.37 |
| 1970s | 9.05 | 10.65 | 19.70 |
| 1980s | 9.13 | 4.77 | 13.90 |
| 1990s | 13.47 | 0.13 | 13.60 |
| 2000s (through July '06) | 7.63 | 2.04 | 9.67 |
Predicting population growth and changes in household size are both important in predicting the need for new housing units. Since population growth is fairly predictable, understanding the reasons for changes in household sizes is the key to determining the number of new housing units needed.
Imagine if household sizes increase - even back to the 2000 level - the number of new housing units required for the remainder of the decade would be much lower than the first 6 years of the 2000s. With the high cost of homeownership, I wouldn't be surprised to see household sizes increase slightly over the next few years, at least until prices fall enough to spur demand.
When we talk about housing units that includes both owner occupied units and rentals. Let's take a look at the rental market:
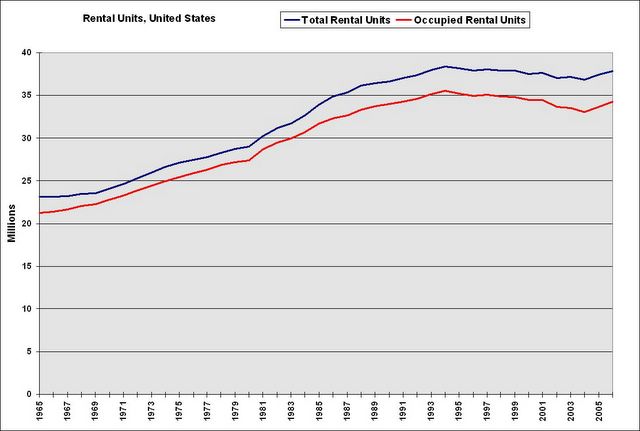 This graph shows the total number of rental units and occupied rental units in the United States. Notice the number of units rose in the '70s as baby boomers moved out of their parent's homes. The number continued to increase sharply in the '80s, but vacancy rates started climbing too. I think this shows there was over-building in the '80s, perhaps because of easy credit from the S&Ls, perhaps because builders were extrapolating demand from the recent past (the '70s).
Then the number of units started falling in the '90s. This probably means units were being converted to condos. In the early '00s, the number of apartments continued to decline as lower interest rates made ownership possible for many renters. Recently the number of apartments has started to increase again - since renting looks more attractive than owning for many Americans.
Mostly I write about New Home sales. New Home sales are from properties developed for sale. When we are talking about total housing units built in any year, we have to include houses built by the owner (either with or without a contractor) and new rentals units.
 As an example, in 2005 there were 1.932 million units completed, of which 1.385 million were built for sale, 308 thousand built by owner, and 239 thousand built as rentals.
New Home sales are units sold from the "Built for Sale" category only.
During the best decade for adding housing units (the '70s because of changes in household sizes) the U.S. added 1.97 million units per year. Last year, the same number of units were added, even though the demographics appear less favorable for housing (household sizes are fairly stable).
I still haven't answered the key question: How far will New Home sales fall? I'm still working on that ...
Sunday, September 03, 2006
Fiscal 2006: Record YTD Increase in National Debt
by Calculated Risk on 9/03/2006 02:37:00 PM
For the first eleven months of fiscal year 2006 (starts Oct 1, 2005), the National Debt has increased $582.3 Billion to $8.515 Trillion. This new record increase eclipses the previous record of $567.7 Billion set in fiscal 2004 for the comparable period.
On an annual basis, the all time record increase in the National Debt was $595.8 Billion, set in fiscal 2004. That record will probably be broken next month. Click on graph for larger image.
The Bush Administration (Cutting deficit ahead of goal) and the CBO (Current Budget Projections) have been projecting a lower budget deficit for fiscal 2006.
So, if the "budget deficit" is improving, why is the annual increase in the National Debt on track to set a new record?
First, a little background - the annual increase in the debt can be broken down into three components:
| Components: Annual Change in the National Debt | ||
| Component | 2006 (1) | 2005 |
| Unified Budget | $260 Billion | $318 Billion |
| Social Security Trust Funds(2) | $177 Billion | $176 Billion |
| Other Trust Funds (3) | $163 Billion | $60 Billion |
| TOTAL: change in National Debt | $600 Billion | $554 Billion |
Note 1: Estimates. Unified budget and Social Security estimates are from CBO, August 17, 2006. The annual increase in the National Debt is my estimate.
Note 2: includes negligible amount from Postal Service.
Note 3: includes some technical adjustments.
Red = negative numbers
The unified budget is "a measure in which every function and activity of government [is] added together to assess the government's fiscal position." (from SSA: Budget Treatment). The Bush Administration reports the unified budget.
Subtracting the annual Social Security balance (currently a surplus) from the Unified budget deficit yields the General Fund or on-budget balance. Currently CBO is projecting the on-budget deficit to be $437 Billion for 2006. This is the amount required by law to be reported as the budget deficit or surplus.
Subtracting all the other trust funds from the on-budget deficit gives the annual increase in the National Debt (with some technical adjustments). Other trust funds include:
Civil Service Retirement and Disability FundSo what happened in fiscal 2006? If the Unified budget deficit is improving, why is the annual increase in the National Debt getting worse?
Federal Hospital Insurance Trust Fund (Medicare Part A)
Military Retirement Fund
Unemployment Trust Fund
DOD Medicare Retirement Fund
Nuclear Waste Disposal Fund, DOE
Deposit Insurance Fund
Employees Life Insurance Fund
Federal Supplemental Medical Insurance (other Medicare)
Foreign Service Retirement & Disability Fund
Pension Benefit Guaranty Corporation
Airport & Airway Trust Fund
Highway Mass Transit and Trust Fund
And many other trust funds.
Looking at the chart, the answer is there was a surge in revenue for the Other Trust Funds. Any increase in these trust funds reduces the "unified budget deficit" and makes the reported number look better.
Why did revenue increase significantly to these trust funds? Unfortunately that takes looking at each fund individually, and we will not have the answers until after the end of the fiscal year.
Take for example the "Federal Supplemental Medical Insurance" trust fund. According to the unaudited monthly treasury statements, the assets of this fund increased from $17.2 Billion at the end of fiscal 2005 to $30.4 Billion at the end of July 2006 (ten months into fiscal year). This is probably due to a short term increase in revenue due to Medicare Part D (prescription drug plan). Over time, Medicare Part D will have a negative impact on the budget, but in the short term this improves the "unified budget" by $13 Billion through July 2006.
For an even more bizarre budget result, look at the Pension Benefit Guaranty Corporation (PBGC) trust fund. The PBGC insures the pensions of 44.1 million American workers and retirees. According to the unaudited treasury statements for Sept 2005 and July 2006, the assets of this trust fund have increased from $13 Billion to $37.4 Billion for the first ten months of fiscal 2006 - reducing the Unified Budget deficit by $24.4 Billion.
We will have to wait for the PBGC annual report to know the details, but a main source for increases in PBGC assets is when the PBGC assumes responsibility for an underfunded pension plan. The assets of the terminated plan go directly to the trust fund, but the liabilities are spread out over many years. On an accrual basis, the liabilities are greater than the assets for the bankrupt plan (by definition, or the PBGC wouldn't have to take responsibility). But on a short term cash basis, the more companies that go bankrupt, the more this improves the current Unified Budget deficit!
Maybe we will get lucky in '07 and GM will go bankrupt, reducing the Unified budget deficit for fiscal 2007. Talk about a perverse result! But this example shows why looking at the Unified budget is insufficient when trying to understand the fiscal difficulties of the United States.
Saturday, September 02, 2006
A Sign of the Times
by Calculated Risk on 9/02/2006 04:12:00 PM
Take Over Payments. No Qualifying. What a difference a year makes! Photo by: Calculated Risk
I took this photo this morning in Sorrento Valley, San Diego. Just last summer, homes in San Diego would come on the market, and have multiple offers on the same day.
Now it's "Take Over Payments". This is probably one step before Jingle Mail.
Friday, September 01, 2006
Construction Spending and Pending Sales
by Calculated Risk on 9/01/2006 10:45:00 AM
From AP: Construction Spending Plummets in July
Construction spending plunged by the largest amount in nearly five years, reflecting spreading weakness in the housing industry.This report was for July and the employment report was for August, but - if both reports are accurate - this implies residential construction workers are still employed, but working less, or at least getting paid less.
The Commerce Department reported Friday that construction activity dropped to a seasonally adjusted annual rate of $1.20 trillion in July, down 1.2 percent from the June level. It was the biggest one-month decline since a 1.3 percent fall in August 2001, when the country was mired in the last recession.
...
The July decline, which followed a 0.4 percent increase in June, was led by a 2 percent fall in private residential construction.
It was the fourth consecutive decline in residential construction and the biggest drop since January 2002, providing dramatic evidence that the nation's five-year housing boom has come to an end. The declines pushed private residential construction down to a seasonally adjusted annual rate of $627.4 billion.
And from the National Association of Realtors: Pending Home Sales Index Points To Easing Market
The Pending Home Sales Index, based on contracts signed in July, is down 7.0 percent to a level of 105.6 from a downwardly revised reading of 113.5 in June, and is 16.0 percent lower than July 2005.And now for some comic relief:
David Lereah, NAR’s chief economist, said there’s a closer relationship between annual changes in the index and actual market performance than there is with month-to-month comparisons. "In looking at year-to-year comparisons, the pending home sales index has been very close in predicting the actual pace of home sales," he said. "Based on recent changes from a year ago, the index shows existing-home sales should continue to ease after a stronger-than-expected decline in July, but are likely to flatten in the months ahead."That is nonsense. There is nothing in this index that indicates sales are "likely to flatten in the months ahead". But I agree with Lereah that fundamentals will prevail.
Lereah said psychological factors account for much of the decline in July home sales. "We’ve never seen a general decline in the housing market against a healthy economic backdrop where jobs are being created, the economy in growing and interest rates are favorable," he said. "Psychological factors are causing some buyers to remain on the sidelines, waiting for prices to stabilize or for more favorable news about the market and the economy. Contributing to this hesitancy is a lot of negative news stories, but in the end we believe that underlying market fundamentals will prevail."
August Employment Report
by Calculated Risk on 9/01/2006 09:09:00 AM
The BLS reports: U.S. nonfarm payrolls climbed by 128,000 in August, after a revised 121,000 gain in July, and the unemployment rate fell slightly to 4.7% in August from 4.8% in July.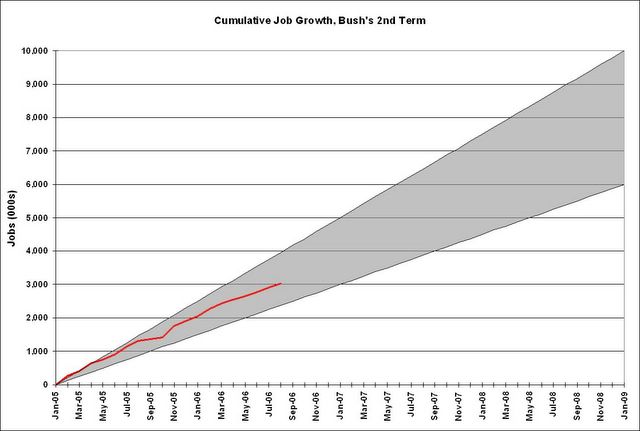 Click on graph for larger image.
Here is the cumulative nonfarm job growth for Bush's 2nd term. The gray area represents the expected job growth (from 6 million to 10 million jobs over the four year term). Job growth is about in the middle of the expected range.
The following two graphs are the areas I've been watching closely: residential construction and retail employment.
Residential construction employment increased by 4,400 jobs in July and is down about 1% from the peak in February. This is a little surprising given the weakness in the housing market.
Note the scale doesn't start from zero: this is to better show the change in employment.
Retail employment declined 13,500 jobs in August. The YoY change in retail employment is now -0.7%.
The YoY decrease in retail employment is concerning: see Retail Employment
The biggest surprise is the small gain in residential construction employment.
BusinessWeek: Toxic Mortgages
by Calculated Risk on 9/01/2006 12:02:00 AM

While many Americans have started to worry about falling home prices, borrowers who jumped into so-called option ARM loans have another, more urgent problem: payments that are about to skyrocket.Make sure you check out the Map of Misery.
The option adjustable rate mortgage (ARM) might be the riskiest and most complicated home loan product ever created. With its temptingly low minimum payments, the option ARM brought a whole new group of buyers into the housing market, extending the boom longer than it could have otherwise lasted, especially in the hottest markets. Suddenly, almost anyone could afford a home -- or so they thought. The option ARM's low payments are only temporary. And the less a borrower chooses to pay now, the more is tacked onto the balance.
The bill is coming due.
Thursday, August 31, 2006
Retail: More Mixed Results
by Calculated Risk on 8/31/2006 04:13:00 PM
Looking forward to Starbucks' results, analysts thought same store sales of 4% would be a negative and 6%+ a positive. So naturally Starbucks reports:
On a comparable store sales basis (stores open for at least 13 months), sales at Company-operated stores increased five percent for the four weeks ended August 27, 2006, as compared to the same four-week period in fiscal 2005.Other retailers reported mixed results too (hat tip Barry Ritholtz): Back-to-school sales mediocre

According to sales tracker First Call, 50 percent of the 52 retailers it tracks beat their sales estimates and 48 percent missed. Total August comparable sales were up 3.7 percent. The firm had forecast sales to increase 3.5 percent, modestly lower than the 3.6 percent increase for the same period a year ago.
"We haven't yet seen a significant implosion in sales," said Perkins.
July Personal Income and Outlays
by Calculated Risk on 8/31/2006 12:41:00 PM
The BEA reported Personal Income and Outlays today for July. There are several positives for the economy in this report.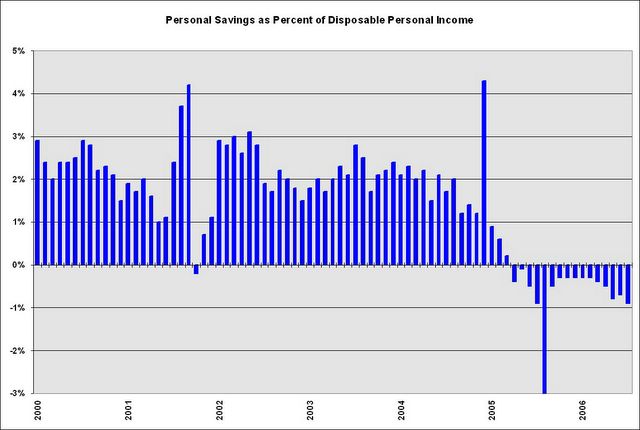 Click on graph for larger image.
The monthly savings rate can be event driven; both Hurricane Katrina, in August 2005, and the Microsoft special dividend, in December 2004, impacted the monthly savings rate.
The savings rate for July was negative 0.9%. This is the sixteenth consecutive month of negative savings. But the good news is the savings rate for recent months has been revised upwards - so the U.S. consumer is in slightly better shape than previous thought.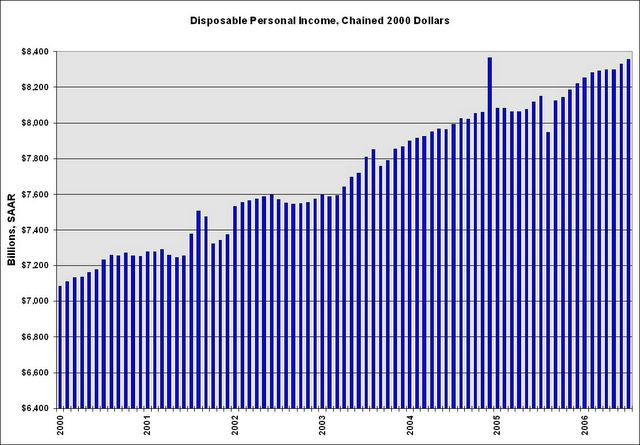 Back in July, Chairman Bernanke commented:
"... favorable fundamentals, including relatively low unemployment and rising disposable incomes, should provide support for consumer spending."In July I was concerned that real disposable personal income had stalled. This report, including the revision for June, shows that real DPI has been rising for the last two months.
Also personal consumption expenditures rose sharply in July, including spending for durable goods. Reports of the death of the American consumer are premature!
On jobs, there was more weakness in the Help Wanted Index
The number of help-wanted ads in U.S. newspapers fell in July, a private research group said on Thursday.knzn has been tracking the job indicators, including the Conference Board and the Monster Employment Index. Overall the job market appears to be weakening and the employment report tomorrow will be interesting. I think it will show the first significant decline in residential construction employment.
The Conference Board said its gauge measuring help-wanted ad volume in the United States was 32 in July, down from a revised 34 in June. The index was originally pegged at 33. It was 39 a year ago.
...
Online want-ad volume fell to about 2.33 million in July, from about 2.44 million in June, the Conference Board said. Online ads reached 2.35 million in May.
Best to All.
Wednesday, August 30, 2006
Retailer Watch
by Calculated Risk on 8/30/2006 08:24:00 PM
I've been looking for signs of a retail slowdown. Here is some more news today:
From MarketWatch: Ethan Allen sales slow in August
Ethan Allen Interiors Inc.'s chairman and chief executive Farooq Kathwari ... said sales have further slowed in August. In a statement, Kathwari said lower consumer confidence and the company's initiative to reduce lead time in filling customer orders has impacted the company's first quarter results. ...On July 27, the Danbury, Conn.-based maker and retailer of home furnishings and accessories said written business in past months had slowed from prior-year levels.From Reuters: Costco cuts forecast as discretionary spending slows
Costco ... warned of lower-than-expected quarterly profit because of disappointing margins, as customers cut back on purchases of big-ticket discretionary items such as furnitureOf course, there is this from the AP: Analysts See Solid August Retail Sales
...
The warning from the largest U.S. warehouse club operator took analysts by surprise because Costco's sales growth has been among the strongest in the retail sector in recent quarters.
...
"This could be an early sign that the higher-income consumer is finally starting to feel a bit of a pinch," said Anthony Chukumba, an analyst with Morningstar.
...
Lower-priced chains such as Wal-Mart Stores Inc. have been feeling ... pressure for more than a year because their lower-income customers are most sensitive to rising energy costs.
There are indications that the economic pain is moving up the income scale. Chukumba noted that housewares retailer Williams-Sonoma Inc. ... cut its profit forecast last week.
Back-to-school shoppers are expected to lift August same-store sales for a handful of retailers, though high energy prices and interest rates will have likely tempered overall retail sales.Overall the retail news isn't bad, and these warnings are not large misses. On Thursday, after the market closes, we will find out how the caffeine addicts (Starbucks) are holding up!
This year, August retail sales are also expected to benefit from tax-free holidays declared in 13 states aimed at helping back-to-school shoppers.
Dow Jones: Subprime mortgages see early defaults
by Calculated Risk on 8/30/2006 04:49:00 PM
Via the Contra Costa Times: Subprime mortgages see early defaults
More subprime borrowers are defaulting in the early months of their home loans ... in recent months, an increasing number of lenders catering to borrowers with weak credit have reported a sharp rise in delinquencies that had occurred as soon as six months after origination.So far no real surprise, but ...
Nationwide, about 3 1/2 subprime loans out of every 10,000 originated between January and June had a delinquency on their first monthly payment ... only one out of every 10,000 subprime loans granted last year had experienced missed payment in their first month. ...
"If those borrowers are finding themselves in trouble very early on, it may give lenders an indication that the underwriting criteria or quality control are not sufficiently tight," says Damien Weldon, director of collateral risk analytics at LoanPerformance. ...
Those early defaults have forced lenders such as NetBank Inc., Fremont General Corp. and H&R Block Inc. to buy back loans already sold to whole-loan acquirers, particularly Wall Street investment banks that pool and package those loans into asset-backed securities and then sell them to large investors such as insurance companies and hedge funds. The buybacks, in turn, have led lenders to incur losses and set aside more money in their reserve funds for potential loan repurchases in the future.These buybacks are interesting. I wonder how many loans these subprime lenders might be forced to buy back?
... H&R Block told investors ... "an increase in early payment delinquencies" and the resulting "higher level of repurchase requests from loan buyers" led it to increase its loan reserves. ...

In Memoriam: Doris "Tanta" Dungey


| Privacy Policy |
| Copyright © 2007 - 2023 CR4RE LLC |