 RSS Feed
 by Calculated Risk on 8/20/2006 11:49:00 PM
Sunday, August 20, 2006
Investment and Recessions
This post will try to explain my focus on residential investment, the usefulness of New Home Sales as a leading indicator, and the current situation.
Note: these graphs may appear cluttered, and for larger versions of each graph, see the links at the end of this post. Click on graph for larger image (see end of post for even larger images)
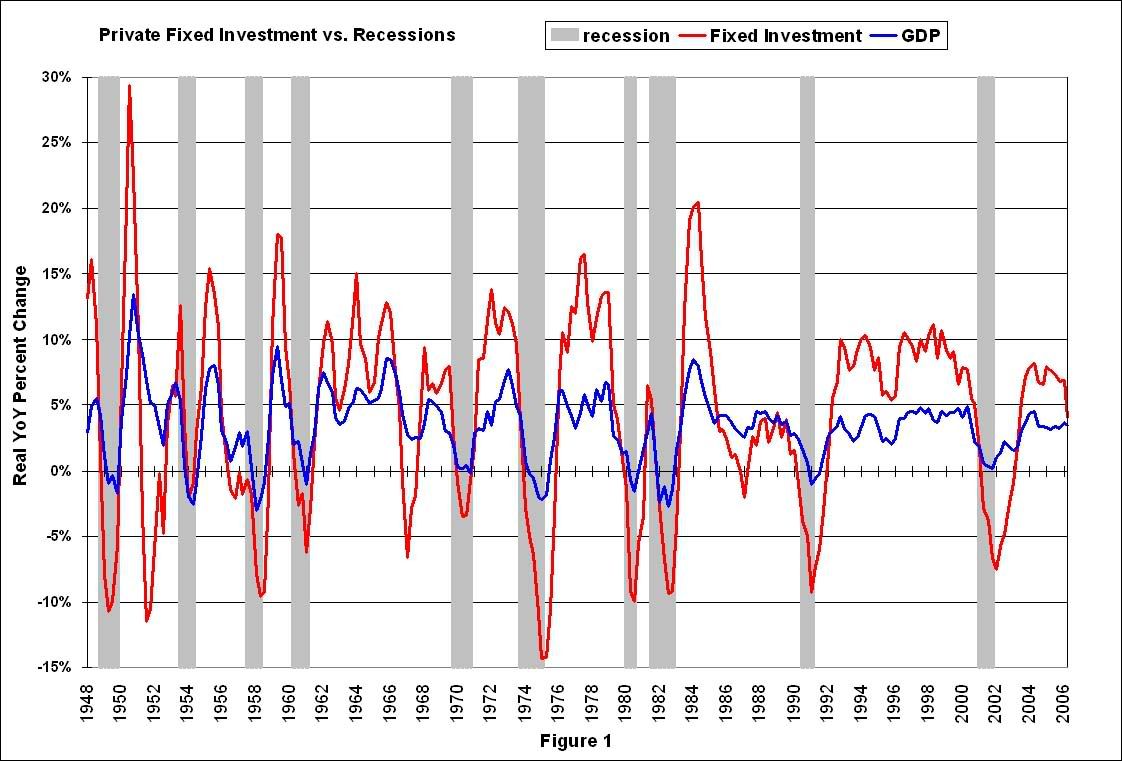
Figure 1 shows the change in real GDP and Private Fixed Investment over the preceding four quarters, shaded areas are recessions. (Source: BEA Table 1.1.1)
A couple of observations:
1) Since 1948, private fixed investment has fallen during every economic recession.
2) Private fixed investment has fallen 13 times since 1948, with only 10 recessions.
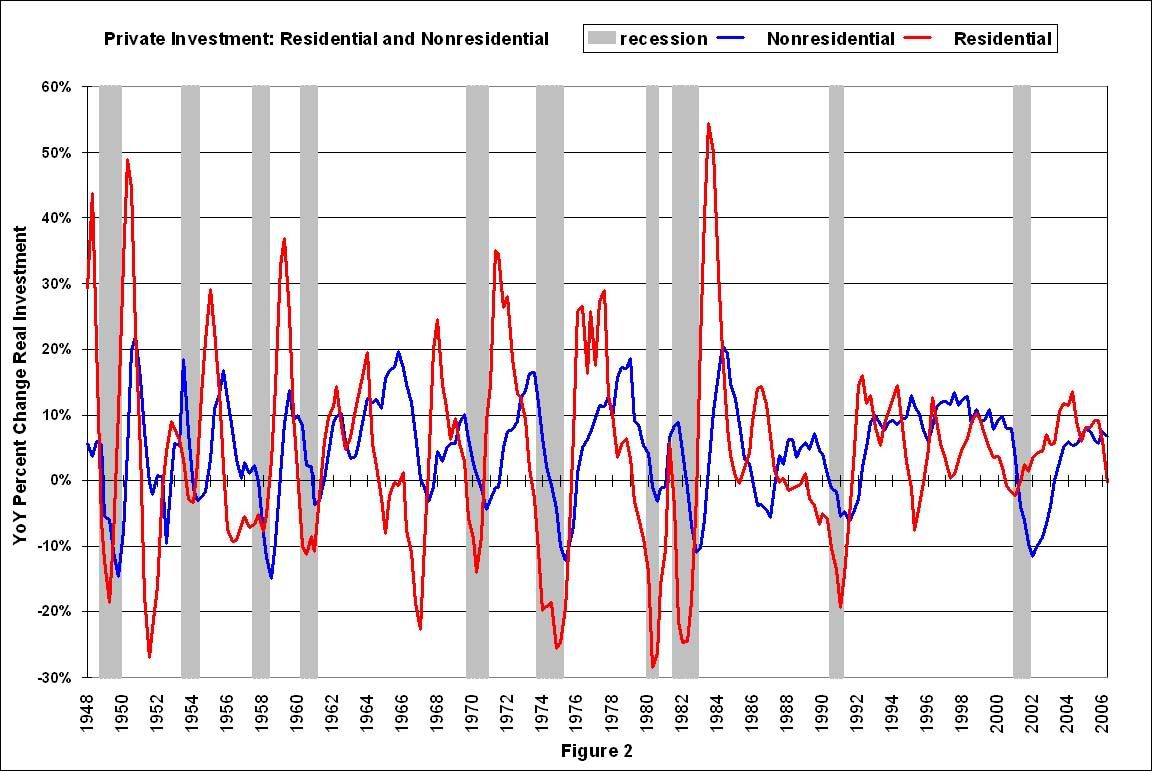
So what happened during the periods around 1951, 1967 and 1986 to keep the economy out of recession? These are the periods when private investment fell, but the economy didn't slide into recession. The answer is generally the same for all three periods: a surge in defense spending. The defense spending in the early '50s was due to the Korean war, in the mid '60s the Vietnam war, and in the mid '80s a general defense build-up helped offset a small decline in private investment. The mid '80s also saw a surge in MEW (mortgage equity withdrawal) that also contributed to GDP growth.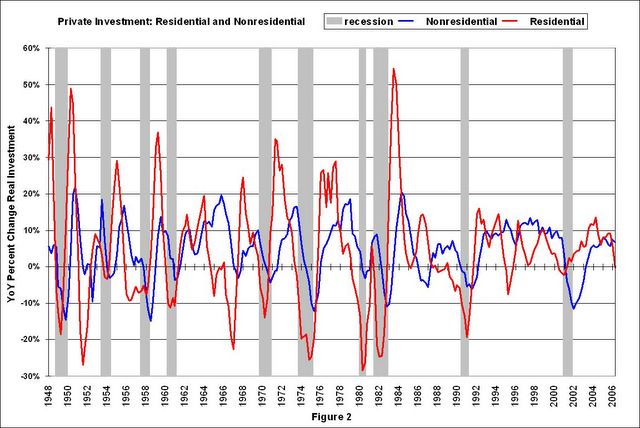 Figure 2 shows the separation of private fixed investment into residential and nonresidential components.
This graphs shows something very interesting: in general, residential investment leads nonresidential investment. There are periods when this observation doesn't hold - like '95 when residential investment fell and the growth of nonresidential investment remained strong.
Another interesting period was 2001 when nonresidential investment fell significantly more than residential investment. Obviously the fall in nonresidential investment was related to the bursting of the stock market bubble.
But the most useful information is that typically recessions are preceded by declines in residential investment. Maybe we can use that information.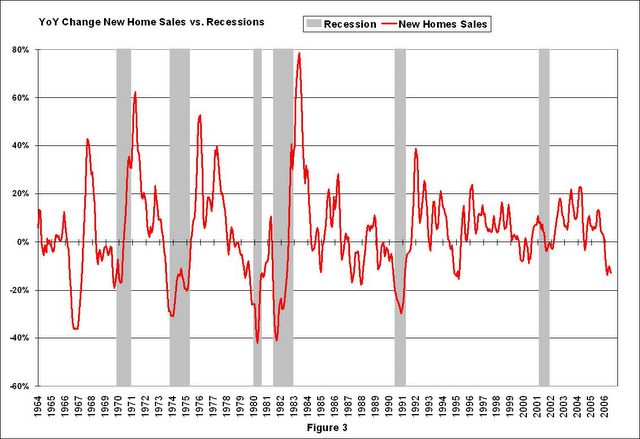
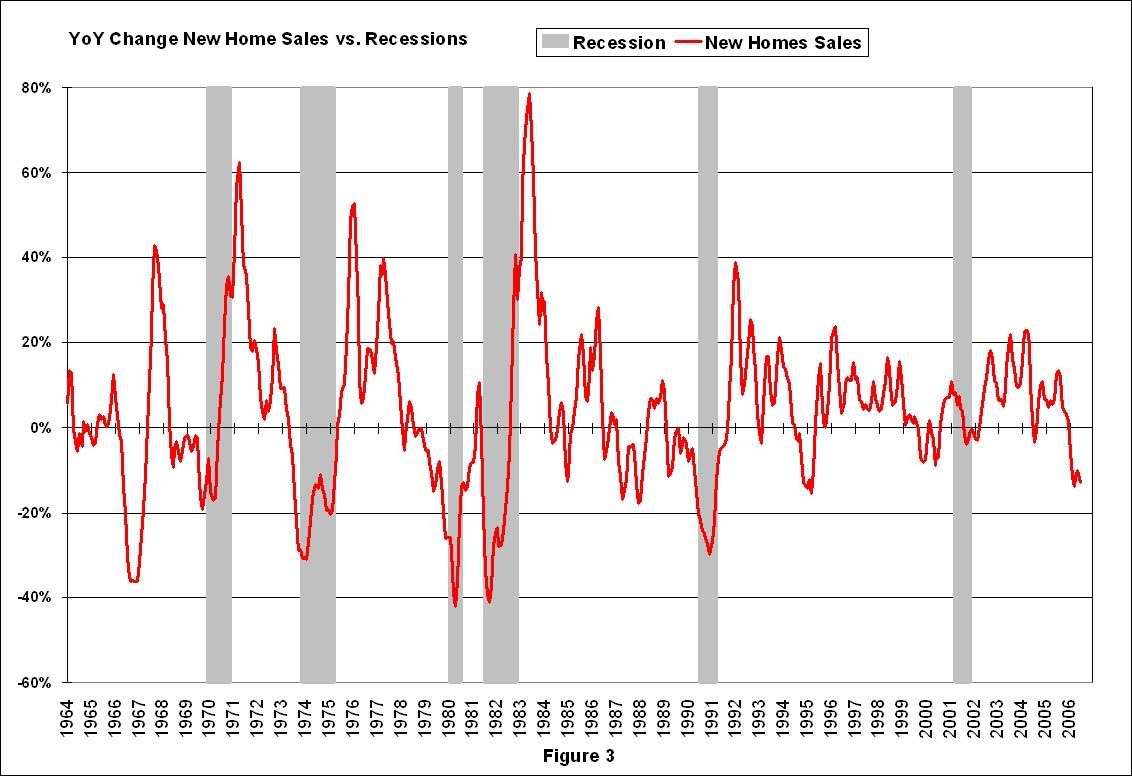
Figure 3 is the YoY change in New Home Sales from the Census Bureau.
Note: the New Home Sales data is smoothed using a three month centered average before calculating the YoY change. The Census Bureau data starts in 1963.
Some observations:
1) When the YoY change in New Home Sales falls about 20%, usually a recession will follow. The one exception for this data series was the mid '60s when the Vietnam buildup kept the economy out of recession.
2) It is also interesting to look at the '86/'87 and the mid '90s periods. New Home sales fell in both of these periods, although not quite 20%. As noted earlier, the mid '80s saw a surge in defense spending and MEW that more than offset the decline in New Home sales. In the mid '90s, nonresidential investment remained strong.
Conclusions:
1) New Home Sales appears to be an excellent leading indicator. However the series is heavily revised and that might limit it's usefulness. I believe the revisions problem can be mitigated using mortgage data from the MBA and builder sentiment from the NAHB to estimate New Home sales (this is for another post).
2) If New Home sales falls to around the 1.05 million level (20% decline), a recession is very likely.
What can offset the decline in New Home sales? Possibilities mentioned earlier are: a surge in defense spending, an increase in consumer borrowing especially MEW, and strong nonresidential investment spending.
An increase in consumer borrowing and MEW seems extremely remote, especially since household debt service is already at record levels. It is far more likely that MEW will fall over the next few years, also acting as a drag on GDP. (A future post will review the contribution from MEW to GDP over the last few years).
Most bullish analysts are forecasting strong nonresidential investment to offset the decrease in residential investment. Maybe. But usually nonresidential investment follows residential investment. Here is a previous post discussing nonresidential investment: Will Business Investment Rescue the Economy?
And defense spending has already increased significantly over the last few years. The implications of a further surge in defense spending, from the current levels, are too scary to contemplate.
NOTE: Click on the links below for 1200x800 graphs in new windows.
Figure 1: Private Fixed Investment vs. Recessions
Friday, August 18, 2006
Mortgage Insurance Companies letter to FDIC: Help!
by Calculated Risk on 8/18/2006 11:36:00 PM
This is the letter referenced in the previous post:Nontraditional Mortgage Guidance: "Within a Few Months"
Mortgage Insurance Companies of America Letter on Nontraditional Mortgage Guidance
I'm not familiar with the mortgage insurance business, but I wonder why the insurers don't just raise their rates for riskier mortgages? Here is the entire letter:
July 10, 2006
Hon. Sheila Bair
Chair
Federal Deposit Insurance Corporation
550 17th Street, N.W.
Washington, DC 20429
Hon. Ben S. Bernanke
Chairman
Board of Governors
Federal Reserve System
20th Street and Constitution Avenue, N.W.
Washington, DC 20551
Hon. Susan S. Bies
Governor
Board of Governors
Federal Reserve System
20th Street and Constitution Avenue, N.W.
Washington, DC 20551
Hon. John C. Dugan
Comptroller of the Currency
250 E Street, S.W.
Washington, DC 20219
Hon. John M. Reich
Director
Office of Thrift Supervision
1700 G Street, N.W.
Washington, DC 20552
Dear Sir or Madam:
The Mortgage Insurance Companies of America (MICA) has long been strongly supportive of the banking agencies' work to ensure appropriate prudential standards for mortgage risk. Mortgage insurers of course have all of their risk concentrated in this area, and we are deeply concerned about the potential contagion effect from poorly-underwritten or unsuitable mortgages and home-equity loans. We hope the agencies will soon finalize the draft guidance released last December on nontraditional mortgages [70 FR 77249], in part because the most recent market trends show alarming signs of ongoing undue risk-taking that puts both lenders and consumers at risk.
Below, I would like quickly to note some recent mortgage-market data that support the proposed guidance and argue for rapid action. MICA has been particularly concerned that the guidance make clear that loans with simultaneous second liens are risky in and of themselves, with these risks of course heightened when they are "layered" with other non-traditional features such as payment-option and interest-only structures. Key recent findings include:
• In June, Standard and Poors (S&P) decided to revise its ratings criteria for mortgages with simultaneous second liens, often called "piggyback" mortgages. (1) This decision brings the S&P rating into alignment with the more conservative one by Moody's and confirms the higher risks posed by these structures. S&P based its decision on research confirming that, holding credit scores equal, mortgages in which the borrower finances the down payment are more likely to default than loans with cash down payments. S&P also concluded that housing markets are likely to experience more stress than originally anticipated, heightening the risk for borrowers with no cash downpayment and, therefore, no equity in their homes.
• The most recent data available from a survey conducted by the National Association of Realtors (2) shows that first-time homeowners - 40% of all borrowers in 2005 - had an average down payment of only 2% on homes costing $150,000, but 43% of these homeowners had no down payment at all.
• In general, non-traditional mortgages have become a still more significant part of the market, despite the cautionary note in the proposed guidance. (3) First-quarter data indicate that interest-only and payment-option products now account for 2 6% of mortgage loan originations - a sharp increase from last year. (4) Even more striking, a recent Fitch report notes that 40-year mortgages with payment-option features now account for 8% of total securitized mortgage volume, up from 2% for all of last year. (5) Subprime mortgages with fixed rates for two years and variable ones for the following 38 years account for 8% of total subprime originations in the first quarter of 2006, up from 2% in all of 2005. (6) Fitch notes particular concern with loans like this because of "double-teaser" clauses.
MICA has noted that industry practice did not change as significantly as required following the final guidance in 2005 on home-equity loans. (7) Although the non-traditional guidance is now only in draft form, one would have expected a far slower growth in industry reliance on non-traditional products in anticipation of final standards with far-reaching market impact. The fact that this did not occur reinforces the suggestion in our earlier comment letter (8) that the final guidance be accompanied by clear language regarding not only consistent enforcement by the agencies, but also clear penalties for those who disregard it.
We would be pleased to provide additional background on the findings noted above or any other market analysis that would be of assistance as your agencies finalize the nontraditional mortgage guidance.
Sincerely,
Suzanne C. Hutchinson signature
Suzanne C. Hutchinson
1) S&P's Rating of Mortgage Pools Is Revised Amid Exotic Lending, Dow Jones Newswire, June 15, 2006.
2) Home Buyer and Seller Survey Shows Rising Use of Internet, Reliance on Agents, January 17, 2006 press release, National Association of Realtors.
3) See Inside Mortgage Finance, February 24, 2006, p.3-6. "Conventional Conforming Market Continued to Decline in 2005 as Nontraditional Mortgage Products Boomed." ARMs totaled $1.49 trillion in 2005 and that was about 47.8 percent of total mortgage originations in 2005. IO and option ARMs together totaled $575 billion of originations which comprised 38.6% of the total ARM business.
4) Inside Mortgage Finance, June 2, 2006, p.4-6, citing statistics from its affiliated publication Inside Alternative Mortgages that during the first quarter of 2006 TO loans and option ARMs "accounted for a hefty 26.4 percent of first quarter originations."
5) Fitch Ratings, "40-, 45-, and 50-Year Mortgages: Option ARMs, Hybrid ARMs, and FRMs," June 19, 2006.
6) Ibid.
7) Credit Risk Management Guidance for Home Equity Lending, Office of the Comptroller of the Currency, Board of Governors of the Federal Reserve System, Federal Deposit Insurance Corporation, Office of Thrift Supervision, and National Credit Union Administration, May 16, 2005.
8) March 29, 2006, Letter to FDIC
Nontraditional Mortgage Guidance: "Within a Few Months"
by Calculated Risk on 8/18/2006 11:18:00 PM
According to the Post:
Regulators say the final version of the rules will be announced within a few months.Excerpts from the WaPo: Insurers Urge Action On Risky Mortgages
Despite regulators' warnings that some popular types of mortgages are risky, lenders are still making them, and mortgage insurance companies have begun pleading with federal banking agencies to act quickly to restrict them.emphasis added
The loans under scrutiny include interest-only mortgages and "option" mortgages, in which borrowers decide each month how much to repay. Because monthly payments are lower than with traditional fixed-rate mortgages, borrowers can buy more expensive houses. In the past five years, millions of Americans have bought or refinanced homes using these loans. The risk comes because eventually these loans "reset," meaning the payment is adjusted upward -- sometimes as much as doubling -- to repay the full interest and principal owed.
"We are deeply concerned about the potential contagion effect from poorly underwritten or unsuitable mortgages and home equity loans," Suzanne C. Hutchinson, executive vice president of the Mortgage Insurance Companies of America, wrote in a recent letter to regulators. ". . . The most recent market trends show alarming signs of undue risk-taking that puts both lenders and consumers at risk."
Many borrowers are paying as little as possible. About 70 percent of the people who take out an option adjustable-rate mortgage, which lets the buyer avoid paying even the full interest on the loan, end up paying the lowest permissible amount each month, according to the Federal Deposit Insurance Corp., which regulates banks. The amount unpaid is added to the mortgage balance, so borrowers end up owing more than when they started. Having no equity in a home increases the risk of foreclosure, especially when housing values fall and houses are hard to sell.
...
In 2000, just 1 percent of American homeowners who got new loans had these types of loans, but by May 2005, about a third of all borrowers did -- about the same percentage as in May 2006, according to new data from First American LoanPerformance, which tracks the statistics.
Countrywide Home Loans Letter to Borrowers
by Calculated Risk on 8/18/2006 02:32:00 PM
Excerpt from the Baltimore Sun: Interest-only loans may start cheap, 'reset' scary
To head off potential problems, the largest mortgage originator in the United States, Countrywide Home Loans, quietly has begun sending out letters to thousands of borrowers who have been making only the minimum payments on the company's popular "PayOption" adjustable-rate mortgages.I'm trying to get a copy of the letter. If anyone has a copy, please send it to me. Thanks!
The letters explain that "this is an early message to alert you that, based on your current payment trends and potential future interest rate changes, the monthly payment you will be required to pay may increase significantly."
A model letter provided to me by Countrywide includes this hypothetical example of what could be ahead for a California homeowner currently making only minimum payments monthly on a $402,000 loan.
The current full interest rate on the loan is 7.6 percent, but the borrower has been paying just $1,348.47, far less than what's needed to fully amortize the mortgage over its 30-year term.
If the loan reset at today's rates, the letter explains, the full payment required would be $2,887.50 - more than double what the homeowner has gotten used to paying. Future reset rates could be even steeper, making the potential payment crunch much worse.
Dallas and the Housing Myth
by Calculated Risk on 8/18/2006 01:13:00 AM
One of the persistent myths is that the housing bust will be local, or only on the coasts. Some analysts have tried to determine "fair value" for various markets, like in this article: Coastal housing markets still way overvalued.
The article suggests housing prices in Dallas are actually 14% undervalued. Click on graph for larger image.
This graph shows nominal and real prices for Dallas (based on OFHEO) since 1987.
Obviously Dallas has not participated in the housing price boom of recent years. In fact real prices are 18% below 1986 prices!
Does that mean Dallas will not experience a housing bust?
It may surprised some people, but Dallas is already in the midst of a housing bust.
UPDATE: Apparently it would surprise Dallas Fed President Richard Fischer. From a speech on Wednesday (hat tip Mark Thoma):
The key area of concern in the real estate markets is the housing market. You know the facts here, so I’ll make this brief by repeating what a friend who has been a major homebuilder since 1973 recently told me: “This is the roughest, most sudden correction we have ever seen in the housing market.”Ahhh, if Texas is "resilient", imagine what will happen everywhere else! Back to orginal post:
It may comfort you to know that of all the markets in America, Texas’ is among the most resilient. In fact, so far this year, single-family permits are up 11 percent from their year-ago pace—the third fastest growth rate among the 50 states and a sharp contrast to the 7 percent year-to-date decline for the U.S. as a whole. Much of our state’s strength reflects the pro-growth climate and low land prices that Texas has to offer.
From the Dallas Morning News: Foreclosures soar in North Texas
Residential foreclosure postings are at record levels ...Prices probably will not fall as much in Dallas, as in Florida or California, but the large number of foreclosures will certainly put pressure on prices.
More than 3,800 houses are threatened with foreclosure next month in the Dallas-Fort Worth area. And for the first nine months of 2006, more than 28,000 home foreclosure postings have been recorded.
"This is bringing back nightmares of 1988 and 1989," when thousands of Texas homeowners lost their properties during a regional recession, said George Roddy, president of Addison-based Foreclosure Listing Service.
"The average number of postings in 1989 was about 2,000 a month," Mr. Roddy said. "And that is when we saw a massive devaluation of residential properties in some areas."
Housing analysts worry that if foreclosure rates stay at current levels, the overall housing market will suffer. This time, however, instead of a recession, poor financial planning and rising living expenses appear to be putting record numbers of North Texans out of their homes.
And notice Mr. Roddy's comment that 1989 saw "massive devaluation of residential properties", and yet the OFHEO series only shows a 13% nominal price drop for Dallas. That is key for housing. A seemingly small drop in prices will be have a significant economic impact and be perceived as "massive".
And finally, Dallas is not having a recession. Nor did Dallas see significant investor and second home buying. The Dallas bust is solely the result of excessive leverage and nontraditional mortgage products. And that should send a chill down the spines of every leveraged homeowner in the "bubble" states.
The housing bust will be nationwide.
Thursday, August 17, 2006
The Budget: Missing Money
by Calculated Risk on 8/17/2006 06:39:00 PM
Professor Chinn posts today: Are we winning the war against the budget deficit? Here is the August CBO report that he references: The Budget and Economic Outlook: An Update
I've posted many times on the difference between the Unified Budget and the General Fund (CBO lists as on-budget) Budget. Now for something different.
Long time readers know I like to track the annual increase in the National Debt. This is usually slightly larger than the General Fund deficit. As an example, for fiscal 2005:
Increase National Debt: $547 Billion.This is a typical gap ($54 Billion) between the two measures. However, for fiscal 2006:
General Fund deficit: $493 Billion.
Increase in National Debt to date: $551 Billion (1.5 months to go until fiscal year end).The non-Social Security off-budget expenditures have increased dramatically this year. My guess is the gap will be close to $160 Billion by the end of the fiscal year. Perhaps this is due to expenditure related to Hurricanes Katrina and Rita that might be off-budget. Or maybe this is a little Enron-style creative accounting.
CBO projected General Fund deficit: $437 Billion.
I don't know. But I'd like to know.
Good News: Initial Claims and Oil
by Calculated Risk on 8/17/2006 11:33:00 AM
Here is some good news. A few weeks ago, Bernanke expressed concern about initial claims rising:
"Gains in payroll employment in recent months have been smaller than their average of the past couple of years, and initial claims for unemployment insurance have edged up. These developments are consistent with the softening in the pace of overall economic activity that seems to be under way."I presented a graph of initial claims at that time.
 Click on graph for larger image.
Here is an updated graph of initial claims for unemployment insurance (four week average) including the Labor Department's report today.
Initial claims have been steady for the last couple of months.
And on oil: There was a brief increase in the spot price of oil to $78 per barrel, earlier this month, after BP announced a major Alaskan field shutting down. Since then, the news had improved and the price of crude oil has fallen almost ten percent: Good news triggers oil price fall
Oil prices have fallen to their lowest level in nearly two months as the continuing ceasefire in Lebanon and healthy US stockpiles calmed markets.Jobs are the key to achieving some sort of soft landing, so the trend in initial claims is definitely good to see. Unfortunately, I think the layoffs in housing related fields have just starting.
Traders said BP's decision to continue oil production from parts of its Prudhoe Bay field in Alaska had also triggered the price movement.
Brent crude was trading down 97 cents at $71.86 a barrel while US light, sweet crude slid $1.12 to $70.77.
Despite the drop, prices are still 14% higher for the year as a whole.
...
A series of positive developments in recent days have boosted sentiment, which had previously been hit by the conflict in Lebanon, kidnappings of foreign oil workers in Nigeria and BP's problems. The troubles had sent Brent prices to a record high above $78 a barrel.
Some of the factors and disruptions that helped drive us to very high levels have been resolved now
...
On Wednesday, the US energy department reported higher-than-expected oil inventories of 331 million barrels.
Stockpiles fell by 1.6 million barrels in the week ending 11 August but the reduction was less than expected given the closure of part of Prudhoe Bay, the largest oil field in the US, due to pipe corrosion.
Inventories remain at almost their highest level since 1999.
And falling oil prices are welcome news and will hopefully offset some of the impact from the housing bust. Two pieces of good news today.
Wednesday, August 16, 2006
Bay Area: Housing Sales at Ten Year Low
by Calculated Risk on 8/16/2006 02:33:00 PM
DataQuick reports: Bay Area home sales decline
Home sales in the Bay Area slowed to their lowest level in ten years as prices increased at their slowest pace since spring 2003, a real estate information service reported.And on prices
A total of 7,941 new and resale houses and condos were sold in the nine-county region last month. That was down 19.1 percent from 9,892 for June, and down 30.8 percent from 11,470 for July last year, according to DataQuick Information Systems.
Last month was the slowest July since 1996 when 7,682 homes were sold. The average July sales count since 1988 is 9,158.
The median price paid for a Bay Area home was $627,000 last month. That was down 2.6 percent from June's record $644,000, and up 3.5 percent from $606,000 for July a year ago. Last month's year-over- year increase was the lowest since May 2003 when the $427,000 median was up 3.4 percent.Note that prices in San Francisco, San Mateo and Marin are down slightly YoY. This is probably the beginning of price declines.
MBA: Refinance Applications Increase
by Calculated Risk on 8/16/2006 09:49:00 AM
The Mortgage Bankers Association (MBA) reports: Refinance Applications Increase 
Click on graph for larger image.
The Market Composite Index, a measure of mortgage loan application volume, was 561.2, an increase of 1.4 percent on a seasonally adjusted basis from 553.3 one week earlier. On an unadjusted basis, the Index increased 0.4 percent compared with the previous week but was down 25.6 percent compared with the same week one year earlier.Mortgage rates increased slightly:
The seasonally-adjusted Purchase Index decreased by 0.8 percent to 385.9 from 388.9 the previous week and the Refinance Index increased by 4.6 percent to 1587.5 from 1518.1 one week earlier.
The average contract interest rate for 30-year fixed-rate mortgages increased to 6.54 percent from 6.45 percent ...Change in mortgage applications from one year ago (from Dow Jones):
The average contract interest rate for one-year ARMs increased to 5.97 percent from 5.96 percent ...
| Total | -25.6% |
| Purchase | -21.9% |
| Refi | -30.5% |
| Fixed-Rate | -23.7% |
| ARM | -29.9% |
Purchase activity continues to fall, and has declined 21.9% compared to the same period last year.
Tuesday, August 15, 2006
Housing: Inverted Reasoning?
by Calculated Risk on 8/15/2006 04:25:00 PM
Housing will experience a soft landing, because the economy and job growth are strong. That appears to be the logic of certain pundits, and California's Inland Empire is an example of this New Millennium economy.
From local economist John Husing last month:
There's just too strong an economy and too much job growth for much other than the "soft landing" Husing and other economists have been predicting for the end of the five-year housing boom.And it's going to get even better as the Inland Empire Braces for Retail Boom:
"We are right on the cusp of a very powerful period in job growth," Husing said. "Local [Inland Empire, San Bernardino/Riverside area] unemployment in May was 4.2 percent, and that's the lowest I have seen for May in 42 years of studying the local economy.
...
"Is the housing market vulnerable?'' he asked. "Yes, it is. But is a bubble likely to happen? No, it is not. The underlying strength of our economy is too great.''
... inhabitants of the Inland Empire should hunker down for an unprecedented retail boom. ... that was the consensus at a panel ... at the first annual RealShare Inland Empire Conference, held [August 9, 2006].That is the optimistic view and many pundits have made the same argument for the entire U.S. economy too. On the other hand, is it possible that the Inland Empire economic boom has been driven by housing, and that the housing bust will start a downward vicious cycle?
First, here is some housing data released today by DataQuick: Southland home sales slowest in nine years; price gains lower.
Southland home sales downshifted last month to the slowest pace in nine years as the rate of appreciation fell to the lowest level since fall 1999, a real estate information service reported.Perhaps the Inland Empire immune to the housing slowdown. The following graphs are based on the DataQuick data. This is a comparison between Los Angeles and the Inland Empire (Riverside and San Bernardino) for the number of housing transactions and median house price.
...
Last month's sales total marked the lowest for a July since 1997, when 22,302 homes sold, and fell below the July average of 24,669 going back to 1988.

The first graph shows the monthly median home prices for Los Angeles, San Bernardino and Riverside since 2002.
Prices in the Inland Empire increased about the same as Los Angeles, and recently appear to have flattened out. Prices in both Riverside and San Bernardino are about 2% below their recent peaks.
 The second graph shows the year-on-year change in the median price for the three markets. YoY price appreciation is falling for all three markets.
 The third graph shows the YoY change in the number of transactions for each market.
There doesn't appear to be anything special about the Inland Empire when comparing the housing market to Los Angeles.
But when we look at employment, the Inland Empire stands out. For the U.S. economy, housing has been one of the main drivers of employment for the last few years. But no local economy has benefited more from the housing boom than the Inland Empire:
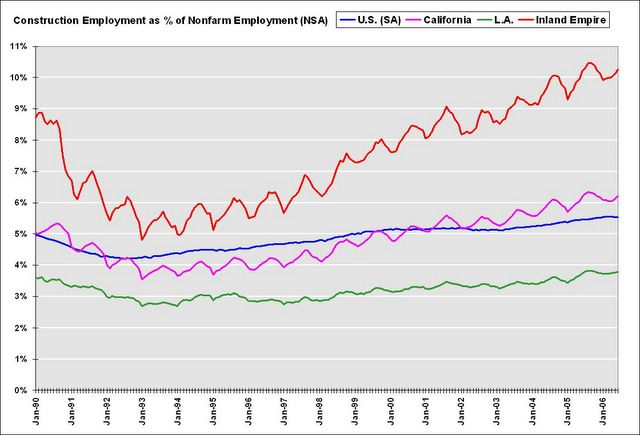
This graph compares construction employment, as a percent of total nonfarm employment, for the U.S., California, Los Angeles and the Inland Empire. Note: Construction includes non-residential construction.
Here is the hierarchy: Los Angeles has benefited less, in terms of employment, than most of California and the U.S. from the housing boom, California has benefited from the housing boom more than most of the U.S., and the Inland Empire is perhaps the greatest beneficiary.

So what happens during a housing bust? Just look at the unemployment rate in the previous bust.
The unemployment rate in California rose from 5.2% to 10.4% in just over two years. For the Inland Empire, the unemployment rate rose from 4.8% to double digits in the same period, peaking at 12.4%. Yes, California was impacted by Defense cutbacks in the early '90s, but the areas that were most dependent on housing saw the largest increases in the unemployment rate.
As the housing bubble unwinds, housing related employment will fall; and fall dramatically in areas like the Inland Empire. The more an area is dependent on housing, the larger the negative impact on the local economy will be.
So I think some pundits have it backwards: Instead of a strong local economy keeping housing afloat, I think the bursting housing bubble will significantly impact housing dependent local economies.


