 RSS Feed
 by Calculated Risk on 8/03/2006 01:41:00 AM
Thursday, August 03, 2006
California Foreclosure Activity Hits Three-Year High
DataQuick reports: California Foreclosure Activity Hits Three-Year High
Lenders sent 20,752 default notices to homeowners statewide during the April-through-June period. That was up 10.5 percent from 18,778 the previous quarter and up 67.2 percent from 12,408 in the second quarter of last year, DataQuick Information Systems reported. Last quarter's year-over-year increase was the highest for any quarter since DataQuick began tracking defaults in 1992.
...
Despite the second quarter surge, defaults remained below historically normal levels. On average, lenders filed 32,762 notices of default each quarter over the past 14 years. Last quarter's 20,752 total was the highest since 25,511 were filed in first quarter 2003.
"This is an important trend to watch but doesn't strike us as ominous," said Marshall Prentice, DataQuick's president. "The increase was a statistical certainty because the number of defaults had fallen to such extreme lows. We would have to see defaults roughly double from today's level before they would begin to impact home values much."
"We hear a lot of talk about rising payments on adjustable-rate loans triggering borrower distress," Prentice continued. "While there's no doubt some of that is going on, as far as we can tell the spike in defaults is mainly the result of slowing price appreciation. It makes it harder for people behind on their mortgage to sell their homes and pay off the lender."
...
Foreclosure activity hit a low during the third quarter of 2004, when lenders filed 12,145 default notices. That year California home prices rose at an annual rate exceeding 20 percent. This year annual price gains have slipped into single digits in many of the state's larger housing markets. Last month San Diego and Sacramento counties saw their median home prices dip about 1 percent compared with a year ago. Second quarter defaults shot up about 99 percent in San Diego County and 109 percent in Sacramento County from last year.
Still, today's statewide foreclosure activity amounts to about one-third of the peak level in the first quarter of 1996, when 59,897 defaults were filed. The state was in a housing slump back then and foreclosure activity tugged home values down by about 10 percent in some areas.
Wednesday, August 02, 2006
Freddie Mac: Q2 Refi Activity Slips, But Remains Strong
by Calculated Risk on 8/02/2006 06:46:00 PM
From Freddie Mac: Refinance Activity Slips, But Still Remains Stronger than Expected in Second Quarter
In the second quarter of 2006, 88 percent of Freddie Mac-owned loans that were refinanced resulted in new mortgages with loan amounts that were at least five percent higher than the original mortgage balances, according to Freddie Mac's quarterly refinance review. This percentage is up from the first quarter of 2006, when the share of refinanced loans that took cash out was a revised 86 percent, and is the highest since the second quarter of 1990.Homeowners are still using the Home ATM.
"The staying power of refinance activity has been much stronger than we initially thought," said Frank Nothaft, Freddie Mac vice president and chief economist. "But borrowers are reacting to both incentives to cash out home equity through refinance and incentives to change their mortgage as they hit an interest rate adjustment. Freddie Mac estimates that $500 billion in first lien mortgages will adjust this year and another $650 billion in second liens will see at least one rate change this year.
...
"The incentive to take cash out of home equity is partially driven by the rapid rise in short-term interest rates like the prime rate. Many borrowers have seen their rates on home equity lines of credit – which are tied to the prime rate – rise. Now they are consolidating those HELOC loans into a new first lien mortgage to reduce their mortgage payments," said Amy Crews Cutts, Freddie Mac deputy chief economist. "This quarter we saw $81.0 billion cashed out, up from a revised $74.1 billion cashed out in the first quarter of 2006. Cash out activity should remain strong throughout the rest of the year as interest rates are expected to continue to gently climb.
"Because rates on home equity lines of credit have risen to 8.25 percent or higher, borrowers who are looking for an inexpensive way to finance home improvements or business investments, or to consolidate high cost debt, are turning to cash-out refinance. These borrowers are often willing to refinance into higher rates on their first lien mortgages. As previously noted, we saw the median ratio of new mortgage rates to rates on the loan being refinanced rise by eight percent. This is second consecutive quarter in which the median refinance borrower increased the rate on their first lien mortgage. For the 20 quarters prior to 2006, the median refinance borrower was reducing his or her first lien mortgage rate."
MBA: Market Index Falls to May 2002 Levels
by Calculated Risk on 8/02/2006 12:21:00 AM
The Mortgage Bankers Association (MBA) reports: Application Volume Declines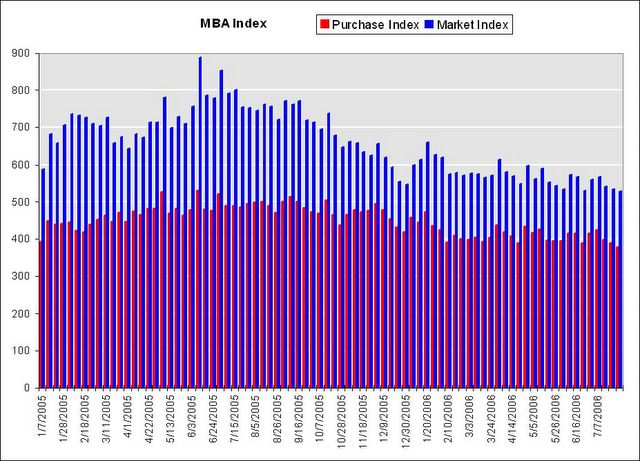
Click on graph for larger image.
The Market Composite Index, a measure of mortgage loan application volume, was 527.6, a decrease of 1.2 percent on a seasonally adjusted basis from 533.8 one week earlier. This is the lowest that the index has been since May 2002. On an unadjusted basis, the Index decreased 1.4 percent compared with the previous week but was down 29.0 percent compared with the same week one year earlier.Mortgage rates decreased:
The seasonally-adjusted Purchase Index decreased by 3.3 percent to 376.2 from 389.0 the previous week and the Refinance Index increased by 2.3 percent to 1417.2 from 1385.2 one week earlier. The Purchase Index is at its lowest since November 2003. emphasis added
The average contract interest rate for 30-year fixed-rate mortgages decreased to 6.62 percent from 6.69 percent ...Change in mortgage applications from one year ago (from Dow Jones):
The average contract interest rate for 15-year fixed-rate mortgages decreased to 6.28 percent from 6.31 percent ...
| Total | -29.0% |
| Purchase | -23.2% |
| Refi | -37.0% |
| Fixed-Rate | -28.2% |
| ARM | -30.7% |
Last week I wrote: "This may be the beginning of another decline in purchase activity." With the Purchase Index off another 3.3%, this does appears to be the start of another leg down for the housing market.
Tuesday, August 01, 2006
YTD Increase in National Debt: $511.6 Billion
by Calculated Risk on 8/01/2006 07:58:00 PM
UPDATE: pgl discusses The Structural Deficit
For the first ten months of the 2006 fiscal year (starts Oct 1st), the National Debt has increased $511.6 Billion. The record is $533.6 Billion for the first ten months of fiscal 2004. This represents an improvement of $21.7 Billion, or about 4%, as compared to fiscal 2004.
The debt increase for fiscal 2006 YTD is slightly worse than fiscal 2005 for the comparable period.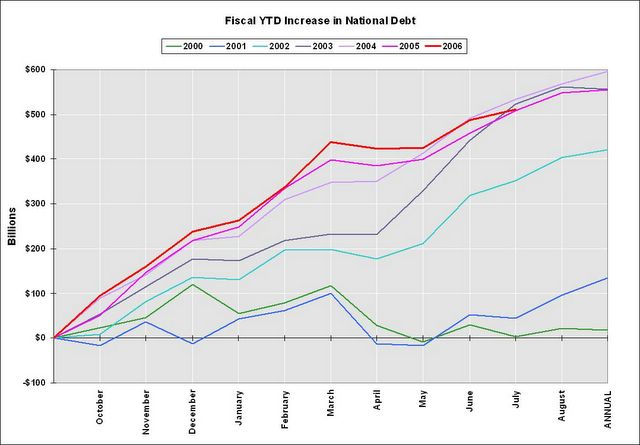
Click on graph for larger image.
As a percent of GDP, the deficit has improved slightly over the last few years.
The annual increase in the debt is running around 4.5% of GDP. This is a classic "structural budget deficit" or "high employment deficit" - something most economists believe should be avoided.
In my predictions for 2006, I wrote that the budget deficit would probably not be a big story this year:
The Budget Deficit: Although I expect the General Fund deficit to grow to around $600 Billion in 2006, I don't think it will become a huge story until '07 or '08.With the slowing economy that prediction still makes sense.
Construction Spending
by Calculated Risk on 8/01/2006 02:42:00 PM
The Census Bureau reported:
The U.S. Census Bureau of the Department of Commerce announced today that construction spending during June 2006 was estimated at a seasonally adjusted annual rate of $1,217.3 billion, 0.3 percent above the revised May estimate of $1,213.8 billion. The June figure is 6.8 percent above the June 2005 estimate of $1,139.9 billion.I'd like to focus on the longer term trend.
During the first 6 months of this year, construction spending amounted to $569.3 billion, 8.5 percent above the $524.8 billion for the same period in 2005.

Click on graph for larger image.
This graph shows construction spending, in Billions of dollars (SA, annual rate) for the three main categories of spending: Private Residential and Nonresidential, and Public spending since 1993.
Private Nonresidential and Public spending have picked up recently, as Private Residential Spending has decreased. Some analysts are hoping that increased Nonresidential spending will mostly offset the decrease in residential spending going forward. This seems unlikely.
 The second graph presents the same data as a percent of GDP. Private Nonresidential spending, as a percent of GDP, is off from the highs of the late '90s, but spending is already near the pace of the mid-90s. Perhaps Private Nonresidential will increase some more, but if Residential spending falls back to 3.5% - 4.0% of GDP, Nonresidential spending will only offset a small portion of this decrease.
Public construction spending, as a percent of GDP, is already near the highs of the last 13 years (data collection started in 1993), and any further increase will be minor in comparison to the probable decrease in future residential spending.
Paulson: "No Recession"
by Calculated Risk on 8/01/2006 12:18:00 PM
From MarketWatch:
Asked if the economy faces a recession in the near term, [Treasury Secretary Henry] Paulson declared, "Absolutely not."I agree with Paulson's approach:
"I have always tried to live by the philosophy that when there is a big problem that needs fixing, you should run toward it, rather than away from it,"Of course the major fiscal problems facing the U.S. are the structural general fund budget deficit and Medicare, not Social Security. So Paulson might be running towards the wrong problem.
June: core PCE and Savings Rate
by Calculated Risk on 8/01/2006 10:01:00 AM
From the BEA report for June:
Core PCE increased 0.2 percent in June (2.9% annualized). Core PCE for June was slightly above the May rate (2.8% annualized), and still above the high end of the FED's assumed target range (2%).
MarketWatch sums it up: Core inflation rising at 11-year high in June
Real consumer spending tepid for fourth straight month
U.S. core consumer inflation matched an 11-year high in June, keeping the pressure on the Federal Reserve to fight inflation, the Commerce Department reported Tuesday.
The core personal consumption expenditure price index, excluding food and energy, increased 0.2% for the third straight month in June, and has risen 2.4% in the past 12 months, matching the largest year-over-year gain since April 1995's 2.5% increase.
...
Meanwhile, personal incomes rose 0.6% in June, outpacing the 0.4% increase in consumer spending.
The personal savings rate rose to negative 1.5% from negative 1.6%, the 15th consecutive month of negative savings. Consumers can have negative savings by spending previous savings, or by borrowing or selling assets to support their consumption.
After adjusting for inflation, real consumer spending rose 0.2% in June, the fourth straight month of tepid spending. Factoring out taxes and inflation, real take-home pay rose 0.4%, the biggest increase in disposable income since December.
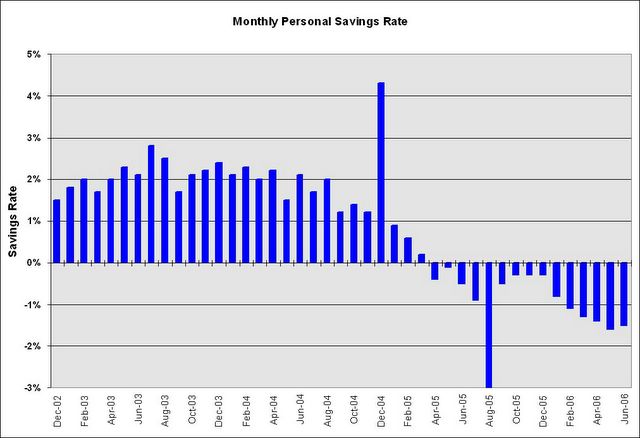
Click on graph for larger image.
The savings rate continued its downward trend. The savings rate, as a percent of DPI, was a negative 1.5%. The Microsoft special dividend (Dec '04) and the impact of hurricane Katrina (Aug '05) are evident in the monthly chart.
Bottomline: Slowing growth, negative savings and too much inflation.
Monday, July 31, 2006
Roubini: Landing "Hard as it gets"
by Calculated Risk on 7/31/2006 07:01:00 PM
Nouriel Roubini writes: Dismal GDP Report: U.S. Is on Its Way to a Recession by Year End
... once the signals of this recession build up, the slowing demand, sales, profits, earnings will severely batter the stock market. Expect 10-15% losses on the major equity indexes between now and year end as the bearish reality of a recession sinks in delusional investors still hoping for a soft landing of the economy. There will be no soft landing; it will be as hard a landing as it gets. So, as Bette Davis said in All About Eve: Fasten your seat belts...it's gonna be a bumpy ride! A very bumpy one for the economy and for all risky assets. In 2006 cash is king and all risky assets (equities, EM bonds, currencies and equities, commodities, credit risks and premia) will be battered once the markets finally comes to the realization that a U.S. recession followed by a serious global slowdown is coming.Brad Setser writes: Growth slowing, oil rising ... not good
[T]he global economy [is at risk] as well. Like Dr. Roubini, I am not convinced that Chinese growth is entirely independent of US growth.And more on the US consumer:
Reuters reports: Whole Foods profit up but sales trail estimates
Whole Foods, based in Austin, Texas, has seen explosive growth in recent years as it added stores and profited from a desire among consumers for healthy food and lifestyles. But the latest quarterly report pointed to slower growth as shoppers wrestle with rising energy prices.AP reports: Tyson Foods Shares Drop on 3rd-Qtr. Loss
Shares of Tyson Foods Inc. shed 3 percent on Monday, after the world's largest meat processor reported a fiscal third-quarter loss and predicted only modest improvement in the fourth quarter.It appears consumers are moving away from the higher priced food stuff (natural and organic foods and chicken) to inferior goods. This is similar to the problem with casual dining that I mentioned last week.
Tyson said a persistent glut of chicken, in particular, led to lower sales prices.
...
"The chicken glut continues. The export demand still is not there yet," Warren said. "It's definitely not a Tyson specific problem."
GDP and Mortgage Interest
by Calculated Risk on 7/31/2006 02:59:00 PM
As a supplement to the GDP report, the Bureau of Economic Analysis provides an estimate of aggregate mortgage interest and the effective rate of interest on mortgage debt outstanding. It should come as no surprise that the effective interest rate is increasing.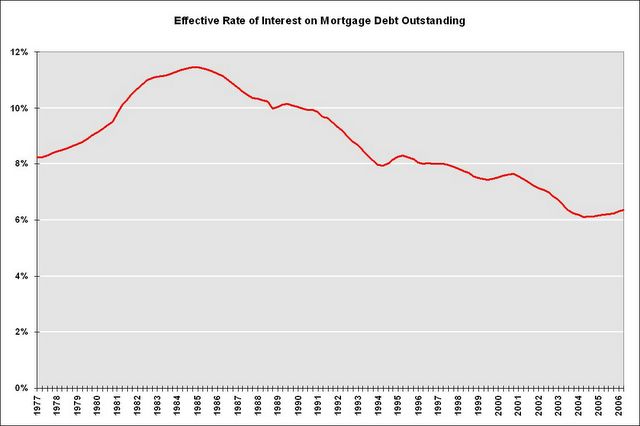
Click on graph for larger image.
After twenty years of declining rates, the effective rate has risen modestly since early 2004. In Q2 2006, the effective rate was 6.373%, up slightly from 6.315% in Q1.
What is surprising is the estimated large increase in mortgage debt in Q2 2006. The actual number will be reported in the FED's Flow of Funds report, due on September 19th, but it appears total mortgage debt increased about $250 to $300 Billion in Q2, or at about the same rate as in 2005.
NOTE: I use the FED's Flow of Funds report to calculate MEW. I'll post an estimated MEW for Q2 in September.
With the slow down in Personal Consumption Expenditures in Q2, it was probably reasonable to expect MEW to fall in Q2 too. This report suggests that MEW was still strong in the second quarter.
It is also no surprise that mortgage interest, as a percent of Disposable Personal Income (DPI), has risen sharply in recent years.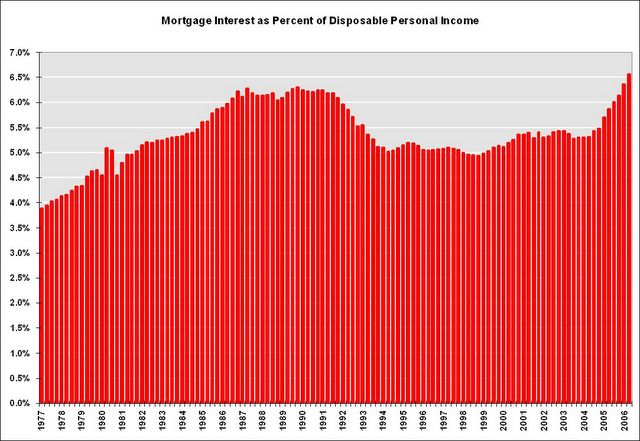 This calculation is similar to the FED's Financial Obligations Ratio (FOR) except this is only for the mortgage interest payment. The current ratio is at an all time high, breaking the record set during the previous housing boom in the late '80s. The ratio will probably continue to go higher since rates are increasing and there are a substantial number of ARMs that will adjust over the next couple of years.
Sunday, July 30, 2006
Goldman Sachs on Housing Prices
by Calculated Risk on 7/30/2006 11:37:00 PM
The Business Online reports: Fears as US house prices to dip for the first time ever
HOUSE prices are set to drop in the US for the first time on record, US investment bank Goldman Sachs warned this weekend.
Prices in several segments of the market have already started to fall, and the overall market will move into the red even in nominal terms next year, fuelling fears that this will trigger a downturn in consumer spending and hit an already slowing US economy.
Jan Hatzius, economist at Goldman Sachs, said: “The risk is rising that nominal US home prices may be headed for an outright decline in 2007. It would be the first decline in national home prices ever recorded, at least in nominal terms.”
In real terms, prices have declined during several periods, including a 9% drop from 1979 to 1984.
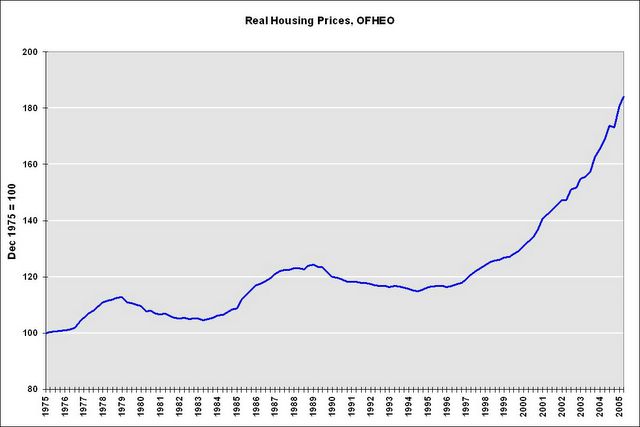
Click on graph for larger image.
This is a graph of the OFHEO real House Price Index adjusted by CPI less shelter. Real prices fell 7.2% from 1979 to 1984. From 1989 to 1995, real prices fell 7.9%.
UPDATE 1: Hatzius used the core PCE deflator and I used CPI less shelter. That is why there is a small difference between the calculations.
The Office of Federal Housing Enterprise Oversight’s index is also likely to show a sharp slowdown for the rest of this year. As of the first quarter of 2006, this index was up 10.1% year-on-year, extremely close to the 10.4% year-on-year increase seen in the National Association of Realtors median-price data.UPDATE 2: Hatzius used the Purchase Only Index that shows a 10.1% YoY increase (see page 6). The OFHEO HPI shows a YoY 12.54% increase (see third page). The nominal quarterly apprection was 2.03%.
Goldman is forecasting that the year-on-year Office of Federal Housing Enterprise Oversight’s index growth could fall to 4% by the second or third quarter of 2006, and possibly into negative territory in 2007.
UPDATE 3: I wrote: Based on OFHEO's method, there is almost no way the year-on-year "index growth could fall to 4% by the second or third quarter of 2006".
Hatzius suggests:
"If you assume roughly flat seasonally adjusted numbers for Q2 and Q3, I calculate the year-on-year rate would drop to 4.2% by Q3. Also, you could get some downward revisions to prior quarters, which would also work in the direction of pushing down the yoy rate."Using the Purchase Only Index, and if Q2 and Q3 are flat (very possible), and there are no revisions, the YoY increase would be 6.95% in Q2 and 4.2% in Q3. So Hatzius' estimate is very possible for Q3, even without any downward revisions. Using the HPI with the same assumptions, Q2 would be 8.6%.
The underlying purchase-only and a seasonally-adjusted purchase-only index can be downloaded here. I agree that we will be seeing both real and nomnal price declines soon.


