 RSS Feed
 by Calculated Risk on 7/30/2006 09:35:00 PM
Sunday, July 30, 2006
Will Business Investment Rescue the Economy?
In the comments to the previous post, Kett82 reads this NY Times article: Housing Slows, Taking Big Toll on the Economy, and then asks:
What is the basis for saying that corporate spending is increasing? I thought the most interesting thing about the Friday’s Commerce Dept GDP report was that corporate spending actually fell by 1.0%.The BEA divides investment spending into Nonresidential and Residential categories. Nonresidential investment includes Structures (spending increased at 12.7% annual rate in Q2) and Equipment and software (decreased at 1.0% annual rate as Kett82 noted). I'm going to combine both categories of nonresidential investment.
The following two graphs show residential and nonresidential investment: the first as a percent of GDP, the second in chained 2000 dollars.

Click on graph for larger image.
This graph shows the slump in nonresidential investment following the bursting of the stock bubble. During the same period, residential investment increased until very recently.
Nonresidential investment has started to increase as a percent of GDP.
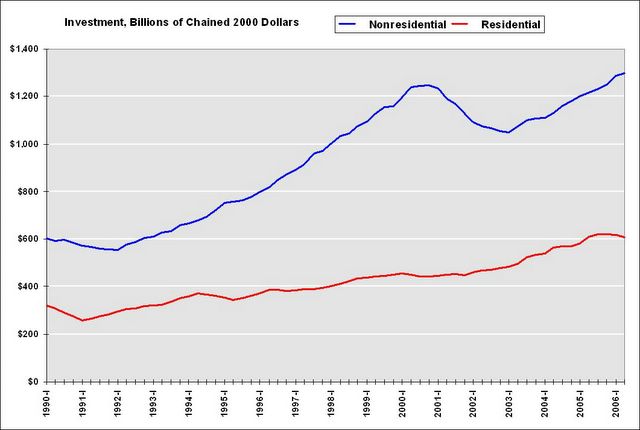
The chained 2000 dollars graph shows the significant pickup in nonresidential investment, in real terms, over the last three years. The reason the blue line appears steep is primarily because the price of software has continued to fall.
I prefer the first graph (percent of GDP). Nonresidential investment, as a percent of GDP, has to increase rapidly to "rescue the economy" from the impact of falling residential investment and a slowdown in consumer spending.
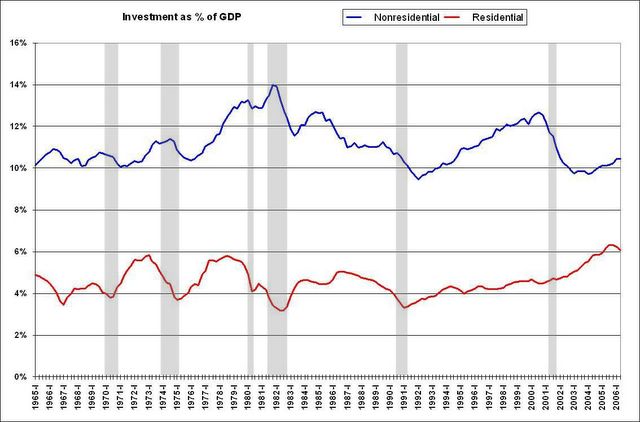
This is a longer term graph of investment as a percent of GDP. The shaded areas are recessions.
Falling residential investment has been an excellent leading indicator for consumer led recessions.
The most recent recession was due to a fall in nonresidential investment. The '90s recession was led by a decline in both types of investment. But for most consumer led recessions, nonresidential investment was still increasing when the recession started.
As an aside, the Great Depression saw a dramatic decline in both nonresidential and residential investment. Nonresidential investment fell 77% from '29 to '33 and residential investment fell 85% over the same period.
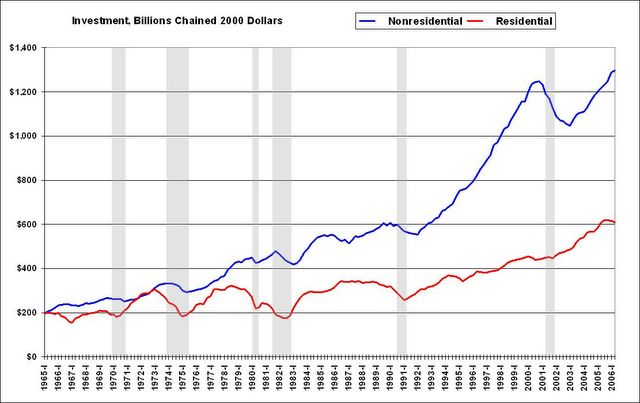
This is a graph of chained 2000 dollars investment spending and recessions.
Although the graph looks a little different (because of falling software prices), it shows that increases in nonresidential investment have not saved the economy when residential investment starts to fall.
From a historical perspective, it doesn't seem likely that business investment will rescue the economy. Kett82 also linked to this AP story: Business spending could bail out economy
Worries about rising oil prices and a cooling housing market may be crimping consumer spending, but some experts bet businesses are poised for a burst of buying.This level of cash provides some hope for increased business investment. However I'm not so certain that companies "have relatively low debt" (I need to do some digging), and historically companies have cut their investment spending in response to economic slowdowns. (See graphs 3 and 4).
The premise rests on this: Companies are flush with cash, have relatively low debt and are racking up huge profits, so it's the right time for them to build and expand factories and upgrade technology systems.
Standard & Poor's reports that the S&P industrials--the S&P 500 minus financials, utilities and transportation issues--are sitting on roughly $633 billion in cash.
Maybe business investment will offset the drop in residential investment and the slowdown in consumer spending, but I wouldn't bet on it.

UPDATE: Here is Total Nonfinancial Business Debt as a Percent of GDP from the Flow of Funds report (see D.3 Debt Outstanding by Sector)
Note: Graph starts at 40% to better show variation.
By other measures, like cash and cash equivalents to total liabilities, business cash positions are solid, but not spectacular.
The phrase "relatively low debt" depends on relative to what. Compared to the debt increases by Households and the Federal Government, nonfinancial business debt hasn't grown much - but it is still at close to record levels. With lower interest rates, business debt service is certainly below record levels (unlike household debt service that sets a new record every quarter). Still, with rising rates and a slowing economy, I don't think business cash levels are the economy's Life Preserver.
Friday, July 28, 2006
Residential Investment Slump: We Ain't Seen Nothin' Yet
by Calculated Risk on 7/28/2006 10:09:00 PM

Click on graph for larger image.
This graph shows annual Residential Investment, in 2000 dollars, since 1976.
2006 is an average of the first two quarters.
In the previous post, I graphed quarterly Residential Investment as a percent of GDP since 1987. This graph shows a decline over the last two quarters, but if this decline in Residential Investment is similar to the previous busts (early '80s and early '90s) then ...
We ain't seen nothing yet!
The early '80s and early 90's busts saw declines of 40% and 25% in Residential Investment respectively. So far, the current decline is about 2% from the quarterly peak of 2005.
Also, it appear residential construction employment closely follows real residential investment with a several quarter lag. If residential investment continues to fall (very likely), then residential construction employment should start decreasing in the 2nd half of 2006. Unfortunately the data series are limited - the data series for residential building started in 1985 and residential specialty contractors in 2001.
Currently there are 3.323 million people employed in residential construction in the U.S. according to the BLS. If the current bust is similar to previous Residential Investment busts, reported residential construction employment might decrease by 800K to 1.3 Million over several years. Actual employment will probably fall even more if there is a substantial underground "cash" economy involved in construction - something I think is likely.
And this is just the impact on residential construction employment. Add in the employment impact on mortgage brokers, RE agents, escrow and title workers, and peripheral employment (like Home Depot, building suppliers, etc.) and the drag on employment over the next few years could be substantial.
Also many of these housing related jobs are relatively high paying with low education requirements, therefore the current job holders might have difficultly finding new jobs with similar pay.
And I haven't even addressed the impact on the consumer from the loss of MEW.
GDP, Residential Investment and Savings
by Calculated Risk on 7/28/2006 10:46:00 AM
The BEA released the Advanced Q2 GDP report this morning.
From Dean Baker: Weakening Housing Market Slows Economy
GDP growth fell to 2.5 percent in the second quarter as consumption growth slowed and housing investment fell sharply. Equipment investment also declined for the first time since the first quarter of 2003. While the growth data is somewhat worse than expected, the report also provides evidence that inflationary pressures are increasing.Here is residential investment as a percent of GDP:
The weak consumption growth is directly related to the weakness in the housing market. Consumers have borrowed heavily against the growing equity in their homes over the last four years, as the savings rate declined from 2.9 percent in the first quarter of 2002 to -1.5 percent in the second quarter of 2006. This drop in savings translated into more than $400 billion in consumption growth over this period. Now that housing prices have stopped rising, and may even be falling in real terms, consumers are losing the ability to borrow further against their homes. This means that the savings rate is unlikely to slide still further into negative territory. As home prices weaken, the savings rate will begin to rise to more normal levels, and consumption growth will trail income growth. If job growth and real wage growth remain weak, then this implies that consumption will grow very slowly or even decline.
Click on graph for larger image.
According to the BEA, the decline in Residential Investment dragged GDP down 0.4% in the 2nd quarter. Recent evidence suggests this "drag" will increase and will probably last for some time.
And the decline in Residential Investment is just the beginning of the impact of housing on GDP. In the second half of 2006, construction employment will probably start to fall, leading to a drag on employment growth and consumer spending.

And, as Dr. Baker noted, the savings rate has gone negative as homeowners have borrowed against their homes to maintain their lifestyle. As housing prices stabilize or decline, MEW (Mortgage Equity Withdrawal) will also decline. This will impact consumption expenditures.
UDPATE: Add graph of Core PCE inflation rate:

The Core PCE (Personal consumption expenditures excluding food and energy) increased at a 2.9% annual rate in Q2. Core PCE is rumored to be one of the FED's favorite inflation measures. This is the largest quarterly percentage increase in core PCE since 1994!
A slowing economy and rising inflation pressures - overall this is a negative report.
Thursday, July 27, 2006
An Evolving View of the Housing Market
by Calculated Risk on 7/27/2006 10:12:00 PM
Mish provides a series of posts from a real estate broker based in Atlanta (Sonnypage on Motley Fool): Lights Out in Georgia. A sample:
Jan 30, 2006:
Our business here on Atlanta's north side is very strong. We have four contracts year to date, we will get number five this week. This compares with twenty six closings in 2005, so we are clearly off to a strong start.July 20, 2006:
...
All of which leaves me free to make my biggest and strongest Sonnypage prediction ever. This time next year, I will still be making money hand over fist, and Mish and Gary Shilling and the rest of the doomsday crowd will still be pumping the next depression.
It's been a "character building year" as another agent in our office put it the other day. What makes it more stunning, at least to me, is that it started out so well. We ended the first quarter with nine deals pending or closed, which is a very solid start. Then we hit a brick wall with only three deals in the second quarter and that would make it our worst second quarter ever in our twelve years.There is much more.
Then it got worse.
New Home Sales and Recessions
by Calculated Risk on 7/27/2006 06:36:00 PM
Updated by popular demand ...

Click on graph for larger image in new window.
The gray columns are economic recessions as defined by NBER.
For consumer led recessions (all but the most recent recession in 2001), New Home Sales were falling prior to the onset of the recession. It appears that New Home Sales peaked last year.
This doesn't imply a cause and effect relationship, but it is something to watch. If New Home Sales can stay above 1.1 million or so that probably increases the probabilities of a soft landing (just slower growth), as opposed to a hard landing (a recession).
New Homes Sales Revisions
by Calculated Risk on 7/27/2006 04:21:00 PM
UPDATE: I've checked more data, and historically revisions can go either way - although negative revisions are more common, especially recently.
As Ed Hopper and Robert Coté mentioned in the comments of the previous post, the New Home Sales number has been consistently revised downwards. I usually note this every month.
Click on graph for larger image.
This graph shows the initial release estimate for New Home Sales (red) followed by the three revisions.
This pattern can also be seen in data for 2004 and 2005 (I haven't checked all data). For whatever reason, the initial release typically overstates New Home Sales - and it is reasonable to guess that the final number (after three revisions) will be around 5% less than the initially reported number.
The final number for June will probably be close to 1.075 Million, a decrease of 14.5% from June 2005, and the lowest June since 2002.
June New Home Sales: 1.131 Million Annual Rate
by Calculated Risk on 7/27/2006 10:04:00 AM
UPDATE: Dr. Hamilton has an excellent post on Seasonal adjustment and new home sales.
According to the Census Bureau report, New Home Sales in June were at a seasonally adjusted annual rate of 1.131 million. Sales for May were revised down to 1.166 million.
Click on Graph for larger image.
Sales of new one-family houses in June 2006 were at a seasonally adjusted annual rate of 1,131,000 ... This is 3.0 percent below the revised May rate of 1,166,000 and is 11.1 percent below the June 2005 estimate of 1,272,000.
The Not Seasonally Adjusted monthly rate was 103,000 New Homes sold. There were 115,000 New Homes sold in June 2005.
On a year over year basis, June 2006 sales were 10.4% lower than June 2005. Also, June '06 sales were slightly below June 2004 (105,000) and June 2003 (107,000) sales.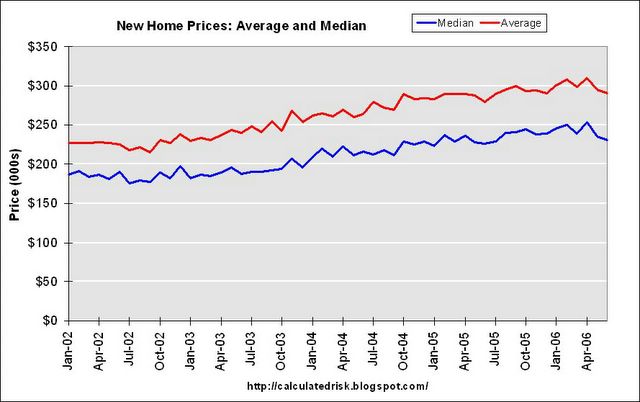
The median and average sales prices were down slightly. Caution should be used when analyzing monthly price changes since prices are heavily revised.
The median sales price of new houses sold in June 2006 was $231,300; the average sales price was $290,600.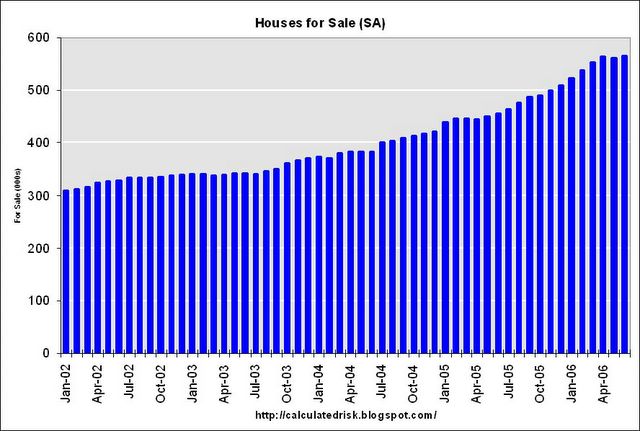
The seasonally adjusted estimate of new houses for sale at the end of June was 566,000. This represents a supply of 6.1 months at the current sales rate.
The 566,000 units of inventory is another record for new houses for sale. 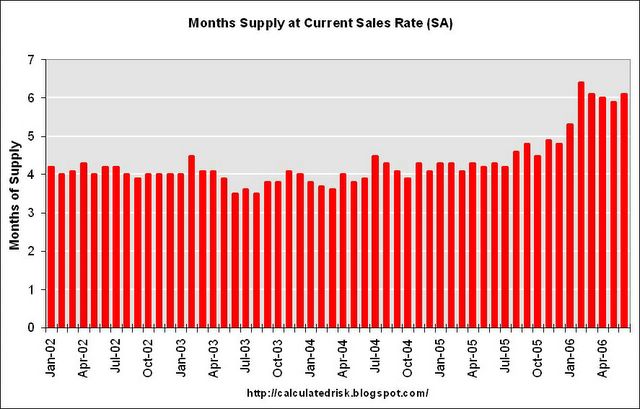
On a months of supply basis, inventory is above the level of recent years.
This report appears stronger than expected based on recent reports from home builders, but the report is slightly weaker than expected by Wall Street estimates.
I suppose this shows that the housing slowdown is orderly - so far.
Wednesday, July 26, 2006
Economic Pessimism Grows
by Calculated Risk on 7/26/2006 06:14:00 PM
The American Research Group has a recent poll on the economy. Here are a few key numbers:
57% say the national economy is getting worse
47% of Americans say their personal financial situations are getting worse
38% of Americans say they believe that the national economy is in a recession

Click on graph for larger image.
We need to be cautious with these results; some academic research has shown that there is very little predictive power in this type of poll. Dr. Dean Croushore said:
"... consumer confidence just reflects the past. You lose your job, your confidence falls. There's not really anything new there. What we really want are indicators that look forward."My guess is those that think the economy will be worse next year are just reflecting current difficulties, primarily gas prices. As an example, when gas prices spiked last year after the hurricanes, those expecting a worse economy in 2006 also increased.
But look at those thinking the economy will improve next year. Only 5% of those polled!
I think this shows consumer psychology is changing. This isn't a "contrary indicator" - growing pessimism leads to consumers pulling back on their spending, and it can become a self-fulfilling prophecy.
Something needs to change or we may see a recession. Maybe gas prices will fall, or real wages start to rise, but clearly the weakening economy is impacting the economic outlook of Americans.
Pulte quarterly earnings and orders tumble
by Calculated Risk on 7/26/2006 05:28:00 PM
Although I don't mention every home builder, Pulte is #2 in the U.S., so ... Reuters reports: Pulte quarterly earnings and orders tumble
Pulte Homes Inc., the No. 2 U.S. home builder, on Wednesday said its quarterly profit fell 20 percent and new orders dropped 30 percent, underscoring the slowdown in the U.S. housing market.Pulte had already warned, so this isn't a big surprise. From the Pulte PR:
"Our second quarter results reflect the changing dynamics being experienced in the homebuilding industry," said Richard J. Dugas, Jr., President and CEO of Pulte Homes. "After several years of limited house inventory and robust demand, the supply of homes for sale continues to increase, while greater buyer uncertainty about purchasing a home at this time is being further impacted by their inability to sell existing homes and the effect higher prices and interest rates are having on overall affordability.UPDATE: Here is a list of the top U.S. home builders, the 2005 Top 10: D. R. Horton, Pulte Homes, Lennar, Centex, KB Homes, Beazer Homes, Hovnanian Enterprises, Ryland Group, M.D.C. Holdings, NVR. I've mentioned Standard Pacific before (#11) and Toll Brothers (#14). I currently have no position in any home builder.
"We continue to adjust key business tactics to effectively meet the more challenging operating environment we face in many markets today.
UPDATE 2: Quotes of the day from: Mortgage lenders grapple with deflating housing bubble
"I've never seen a soft-landing in 53 years, so we have a ways to go before this levels out," Countrywide Chief Executive Officer Angelo Mozilo said on a Tuesday conference call. "I have to prepare the company for the worst that can happen."
...
Countrywide's Mozilo said. "The only thing that's really holding back the dam now is that we have good employment numbers."
More on Casual Dining
by Calculated Risk on 7/26/2006 04:13:00 PM
Applebee's just missed:
System-wide domestic comparable sales for the second quarter of 2006 decreased 1.8 percent.Notice that the results are trending down: sales decreased 1.8% for the quarter, 3.0% for June, and 3.6% for July.
...
The company also reported comparable sales for the June fiscal period, comprised of the five weeks ended June 25, 2006. System-wide domestic comparable sales decreased 3.0 percent for the June period.
...
In addition, the company reported comparable sales for the July fiscal period, comprised of the four weeks ended July 23, 2006. System-wide domestic comparable sales decreased 3.6 percent for the July period
...
Lloyd Hill, chairman and chief executive officer, said, "We are disappointed that our efforts to broaden our reach have been masked by the challenging consumer spending environment. As we are uncertain as to when the environment will start to improve, we are taking a more conservative view in our outlook for the remainder of the year." emphasis added.
Casual dining is a discretionary expense and is frequently one of the first espenses that consumers reduce during hard times. Add APPB to the list in the previous post.
UPDATE: Also impacted by the housing and consumer slowdown: Housing slowdown hits Black & Decker profits
On a conference call with analysts Wednesday, officials said the drop in retailer and consumer demand for some home improvement products provided further evidence of a housing slowdown.


