 RSS Feed
 by Calculated Risk on 1/06/2006 08:19:00 PM
Friday, January 06, 2006
What will the Fed do?
Here is another Fed Watch from Dr. Duy: A Little Something for Everyone. Duy mostly looks at the employment report, but he also writes:
Wall Street's stamp of approval implies a wide expectation of "one and done" for this tightening cycle. That's not quite my interpretation, although I can't blame traders for looking for good news after a dreary December. Instead, I left the minutes with the sense that another rate hike at the end of the month is in the bag, but beyond that, future changes in policy are not automatic but instead data dependent. That is decidedly not the same thing as "done."Barring some drastic change in the data, I think two more rate hikes are "in the bag" and we will see 4.75% at the March meeting.
As a note: Dr. Duy's Fed Watch is a regular column on Economist's View. For weekly updates on market expectations for the Fed Funds rate, see Dr. Altig's Macroblog.
The reason I think the Fed will raise rates at least two more times is because: 1)the data will probably be inconclusive and 2) Dr. Bernanke has been heavily criticized (I think unfairly) for being an inflation dove based on this speech: Deflation: Making Sure "It" Doesn't Happen Here and, therefore, if the Fed pauses at Bernanke's first meeting in March that would inflame the criticism. So I believe Bernanke will lean towards one more hike to prove his inflation fighting credentials.

Click on graph for larger image.
Using the Cleveland Fed Median CPI, this graph shows the real Fed Funds rate by quarter for the last five years - the period of emergency interest rates.
I think the Fed would like to see inflation below 2% - median CPI was 2.6% annualized last month and 2.4% over the last 12 months. To achieve their goal, the Fed will probably have to raise the real Fed rate to 2% to 2.5% and that puts the nominal Fed Funds rate at 4.75% or even 5%.
After the January hike, the key data will be the various measures of inflation. If inflation is subsiding, then the Fed might stop. If its close, I expect another hike in March.
When will the Fed cut rates?
I've written several times that I expect a rate cut later this year. The reason I expect a cut is because of the impact of a housing slowdown. If there is no housing slowdown, as predicted by Wells Fargo, then I doubt we will see a rate cut in 2006. If there is a slowdown, I expect two things: 1) Mortgage equity withdrawal to decrease significantly and impact consumer spending (like what happened in England) and 2) housing related employment to fall.
The Fed doesn't like to change directions too quickly. Looking at the Fed's recent history:
Rates peaked at 6.5% on May 16, 2000 and the first rate cut was almost 9 months later, in January 2001.And speaking of England, the Bank of England repo rate peaked in August 2004 at 4.75% and the BOE cut the rate to 4.5% one year later.
Rates peaked at 6% on Feb 1, 1995 and the first cut was 5 months later in July.
So, if housing slows down, I expect a rate cut in late 2006.
Wells Fargo forecasts 6.5% 2006 SoCal House Appreciation
by Calculated Risk on 1/06/2006 04:43:00 PM
Wells Fargo is forecasting 6.5% house price appreciation in Southern California for 2006 compared to their estimate of 14.3% in 2005.
An internal forecast from a Wells Fargo Senior Economist:
| Wells Fargo Forecast | 2005(est) | 2006(f) |
| Median Existing Home Price | $489K | $521K |
| Percent Change in Prices | 14.3% | 6.5% |
| Housing Starts | 101.3K | 103.4K |
| Single Family Starts | 72.4K | 74.3K |
| Multifamily Starts | 28.8K | 29.K |
Christopher Thornberg, senior economist with the UCLA Forecast, expects housing construction to drop by 25 percent next year, resulting in significant job loss for the construction industry.Two very different views.
Employment Report
by Calculated Risk on 1/06/2006 02:37:00 PM
The BLS reported:
"Total nonfarm payroll employment increased by 108,000 in December, and the unemployment rate was little changed at 4.9 percent"Kash calls the report "disappointing" and pgl looks at the labor force participation rate and the employment-population ratio.
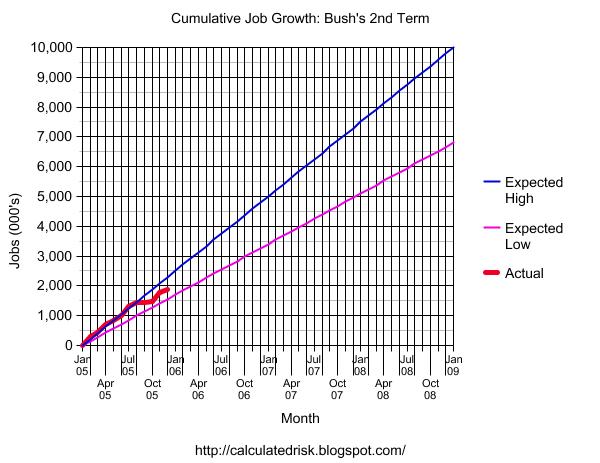
Click on graph for larger image.
Although the December report might be disappointing, the number of jobs created in 2005 seems solid.
A major concern going forward is the impact of a housing slowdown. Housing was once again a key driver for employment gains in 2005; construction alone added almost 250K jobs. Since construction usually accounts for around 5% of total employment, I would have expected around 100K construction jobs given the total employment growth.
The good news is the economy has been adding jobs at around the expected rate. The bad news is the economy is probably still too "housing centric".
Thursday, January 05, 2006
Mortgage Spread
by Calculated Risk on 1/05/2006 04:59:00 PM
The spread between the yields of a 30 year fixed mortgage (as reported by the MBA) and the Ten Year Treasury note has widened steadily over the past year.
Click on graph for larger image.
If the current spread was 145 bps, as in early 2005, the rate on a 30 year mortgage would be about 5.7% today.
Instead, the rate on a 30 year fixed mortgage is 6.15%.
That is a substantial increase in the spread and I'm guessing it indicates investors have become increasingly wary of mortgage backed securities.
Wednesday, January 04, 2006
UCLA's Thornberg expects 25% decline in housing construction
by Calculated Risk on 1/04/2006 06:56:00 PM
The Contra Costa Times reports: Home builders see flat housing starts
California's 12-year run of home building gains will likely end in 2006, as developers pause to clear out excess inventory during the early part of the year, according to a trade group's annual housing forecast.Dr. Thornberg is not so optimistic:
The Sacramento-based California Building Industry Association report released Wednesday also predicted the state's torrid pace of housing price advances will slow, to between 5 percent and 8 percent per square foot. That's well off the 25 percent to 30 percent increases of the past few years.
The first quarter in particular could promise some price relief, as home builders pony up concessions to slice their growing inventory levels, said Alan Nevin, CBIA chief economist.
...
Statewide, the CBIA projects 185,000 to 205,000 new housing permits in 2006, down from an estimated 212,000 last year. Most of the decline will likely be in the high-end segment in coastal areas. Transactions in the resale market will likely fall to between 550,000 and 600,000, down from a recent high of 650,000.
Given the decline in housing construction, the CBIA also expects to see a "modest pull-back" in construction employment, which accounted for 13 percent of the more than 400,000 new California jobs created in 2005.
Christopher Thornberg, senior economist with the UCLA Forecast, expects housing construction to drop by 25 percent next year, resulting in significant job loss for the construction industry.
He said the CBIA's pricing prediction could prove true, but he hopes it doesn't because he believes prices are already "out of whack with reality."
"The real question is, is it a good thing if they go up and the answer is clearly 'no,'" he said. "It will just make things that much worse and it will take that much longer to correct."
MBA: Mortgage Activity Declines
by Calculated Risk on 1/04/2006 11:50:00 AM
The Mortgage Bankers Association (MBA) reports: ARM Applications Down in Latest Survey
Click on graph for larger image.
The Market Composite Index - a measure of mortgage loan application volume was 545.9 -- a decrease of 1.5 percent on a seasonally adjusted basis from 554.1 one week earlier. A holiday adjustment was included in the seasonally adjusted numbers to help account for the reduced application activity during the holiday week. On an unadjusted basis, the Index decreased 20.8 percent compared with the previous week and was down 9.9 percent compared with the same week one year earlier.Rates on fixed rate mortgages decreased, while rates for ARMs increased:
The seasonally-adjusted Purchase Index decreased by 4.5 percent to 432.9 from 453.1 the previous week whereas the Refinance Index decreased by 11.2 percent to 1259.1 from 1418.1 one week earlier.
The average contract interest rate for 30-year fixed-rate mortgages decreased to 6.15 percent from 6.21 percent on week earlier ...Activity is falling, but still reasonably strong. The YoY decline of 9.9% for the same week is concerning. These reports will be more informative after the holidays.
The average contract interest rate for one-year ARMs increased to 5.41 percent from 5.36 percent one week earlier...
Tuesday, January 03, 2006
Fiscal 2006: Record YTD Increase in National Debt
by Calculated Risk on 1/03/2006 07:25:00 PM
After three months, Fiscal 2006 continues to set new records for the YTD increase in National Debt. For the first three months of fiscal year 2006, the National Debt increased $237.7 Billion to $8.17 Trillion as of Dec 30, 2005. 
Click on graph for larger image.
The previous record for the first three months was in fiscal 2004 with an increase in the National Debt of $218.1 Billion.
Each month I will plot the YTD increase in the National Debt and compare it to the proceeding years. I expect fiscal 2006 to set a new record for the annual increase in the National Debt.
Two Views: Debt, Deficit and Social Security
by Calculated Risk on 1/03/2006 01:53:00 PM
There are two distinct views of the US fiscal situation.
VIEW 1:
National Debt = $8.1 Trillion or about 63% of GDP.VIEW 2:
General Fund Deficit = ~$600 Billion per year (about 4.7% of GDP)
Social Security Insurance (SSI) has a small, but manageable shortfall.
Publicly held portion of the National Debt is $4.7 Trillion or 37% of GDP. The rest of the National Debt the US owes to itself.Dr. Thoma posted Mankiw's Guidelines for Policy Makers. Mankiw's first resolution for policy makers:
Unified Budget Deficit = ~ $350 Billion per year - a problem, but manageable.
Social Security Insurance is a massive problem.
Mankiw's #1: "This year I will be straight about the budget mess. I know that the federal budget is on an unsustainable path. I know that when the baby-boom generation retires and becomes eligible for Social Security and Medicare, all hell is going to break loose. I know that the choices aren't pretty -- either large cuts in promised benefits or taxes vastly higher than anything ever experienced in U.S. history. I am going to admit these facts to the American people, and I am going to say which choice I favor."Obviously Mankiw holds View #2 above. One of the unstated, but obvious components of View #2, is that the excess SSI taxes collected over the last 20+ years has really just been another General Fund tax. In the eyes of Mankiw, these extra payroll taxes have been a surreptitious method of instituting a flatter tax system.
Ostensibly the excess payroll tax is not a General Fund tax; it is a prepayment on future benefits. Legally, the General Fund receives most of its revenue from high income individuals, whereas the revenue burden for the SSI Trust Fund falls mostly on low and middle income wage earners.
Those holding View #1 see reversing the Bush tax shifts as the primary method for restoring fiscal balance. By bringing the General Fund back into balance, SSI is only a minor problem.
Those holding View #2 see cutting future benefits, primarily for low and middle income earners, as the solution for restoring fiscal balance.
So its a question of who pays: high income earners or low and middle income earners.
Although this is mostly a normative question, View #1 has the advantage of being straightforward. In fact, any politician who really explained View #2 to their constituents would likely be removed from office, tarred and feathered, or far worse.
Monday, January 02, 2006
G.R.E.B.B. Day
by Calculated Risk on 1/02/2006 03:53:00 PM
My friend, Ramsey, has started calling Feb 1, 2006 G.R.E.B.B. DAY (Greenspan real estate bubble bursting day). Very funny.
Although I think the slowdown will be gradual, Ramsey provided the following data today on the San Diego housing market:
San Diego real estate update:I've felt the housing slowdown would start with rising inventories, followed by falling transaction volumes, and then falling prices. Inventories for both new and existing homes have been rising for months. Now the second phase may be starting: from Ramsey's comparison of Dec 2005 to Dec 2004 for San Diego, transaction volumes dropped significantly (36%).
December 05 closings 2,107
That is 36.2% less than YTY Dec 04 of 3,300
That is 12.7% less than sequential Nov 05 of 2,414
2005 total closings 39,950
2004 total closings 42,809
December 05 avg sold price $633,223
That is 9.2% higher than YTY Dec 04 of $579,749
That is 1.3% higher than sequential Nov 05 of $625,172
December 05 closings averaged 63 days on market.
That is 16.6% longer than YTY Dec 04 of 54 days.
That is 6.8% longer than sequential Nov 05 of 59 days.
Avg days on market for all 2005 closings was 52 days.
Avg days on market for all 2004 closings was 33 days.
32.9% of Dec 05 sales were condos.
35.1% of all 2005 sales were condos.
December 05 pending sales 1,775
Jan 06 closings, based on Dec 05 pendings, are going to fall off the cliff unless sales miraculously pick up right now.
For sale inventory peaked at just over 15,000 early December 05 and dropped back to 13,876 on Dec 31, 05 due to the holidays. We should see a number of listings coming back on the market soon. How fast this inventory gets absorbed is going to tell us the health of the market.
It is no surprise that inventories fell in December. That happens every year as sellers take their houses off the market during the holidays. When the December existing homes numbers are released, I expect inventories to fall 10% to 20% from 2,903,000 in November (in 2004, inventories dropped 13% from November to December). That doesn't mean the market is recovering - it is just part of the seasonal pattern.
Sunday, January 01, 2006
Interesting Times
by Calculated Risk on 1/01/2006 09:18:00 PM
Happy New Year to All! It does appear we are living in interesting times. The biggest story of the New Year is the Constitutional Crisis concerning the warrantless surveillance of US citizens. And on the economic front, housing is still the hot topic.
The San Diego Union has a series of articles on housing:
Understand risks of 'creative' loans
Creative loans push overextended owners into dangerous waters
When she bought her two-bedroom condominium in Mira Mesa in mid-2004, Elizabeth Eure didn't envision herself one day sleeping on an egg-crate mattress in an empty unit.Pressure grows as market cools
The furniture was gone in December because Eure was preparing to move, awaiting the close of escrow. After living there less than a year and a half, she had sold her home to cut her losses. Her monthly mortgage payment of $2,500 was too much for her to handle.
"It was a mistake," Eure, 29, said of the purchase. "If I could do it all over again, I would have rented an apartment."
Richard Mehren, a real estate agent who specializes in condominiums, said Eure's predicament is a common one. Many recent buyers are beginning to realize they have taken on too much debt.
And from the Southwest Florida Herald Tribune: Clock is running down on 'cheap' mortgages
Lenders who started making those teaser-rate loans a few years ago are getting ready to charge real-world payments on them.
Starting in 2006 and accelerating into 2007, as much as $2.5 trillion worth of the fancy mortgages called "hybrids" are coming to the end of the free-lunch part of the deal.
And while prices in Southwest Florida are hovering at twice those of three years ago, the house party seems to have ended in July. Since then, as mortgage rates continue their upward creep, inventories are stacking up, while the rate of closings is slowing down.


