 RSS Feed
 by Calculated Risk on 12/06/2005 11:46:00 AM
Tuesday, December 06, 2005
Housing Bubble Bursts in U.S. Mortgage Bond Market
Bloomberg reports: Housing Bubble Bursts in U.S. Mortgage Bond Market
Bonds backed by home loans to the riskiest borrowers, the fastest growing part of the $7.6 trillion mortgage market, have lost about 2.5 percent since September on concern an 18-month rise in interest rates may force more than 150,000 consumers to default.This is really no surprise. Many marginal buyers used excessive leverage (a type of speculation) to purchase a home. They were hoping that continued home price appreciation would bail them out, if their personal financial situation did not improve.
``We've been hearing about risks of a house price bubble, easy credit and loans to borrowers that really don't qualify, and now in the last couple of months we're starting to see things turn for the worse,'' said Joseph Auth, a bond fund manager who helps oversee $135 billion at Standish Mellon Asset Management in Boston. ``We don't know if it's going to be a hard or soft landing.''
...
The slump in the bonds is one of the first signs the housing boom is ending after the Federal Reserve's 12 interest- rate increases. Real estate has accounted for about half the economy's growth since 2001, according to Merrill Lynch & Co.
...
About 13.4 percent of all mortgages at the end of June were to borrowers considered most likely to default, such as those with high credit card balances, up from 2.4 percent in 1998, according to the Mortgage Bankers Association. The Washington- based trade group's 2,700 members represent 70 percent of the home-loan business.
The amount of bonds backed by these high-risk loans has more than doubled since 2001, to a record $476 billion, according to the Bond Market Association, a New York-based trade group of more than 200 securities firms.
The market ``will deteriorate as housing slows down,'' said Christopher Flanagan, who runs asset-backed debt research at New York-based JPMorgan Chase & Co., the fourth-largest mortgage lender in the U.S. The amount of loans made next year may fall by as much as 25 percent, he said.
...
The last time delinquency rates on lower-rated mortgages jumped was in 2000 as economic growth slumped following the Fed's six rate increases. The central bank has lifted rates 12 times since June 2004, to 4 percent from 1 percent.
...
Delinquencies tend to peak two to three years after subprime loans are originated, said Glenn Costello, an analyst at Fitch Ratings in New York. Peak rates of about 20 percent to 25 percent now will likely rise to the high-20s in 2006, he said.
...
Lenders that rushed to provide mortgages amid rising home prices are now stuck with loans worth less than they expected because bond investors are demanding more protection. They are raising mortgage rates help to make up the difference.
...
``In a rapidly changing environment, you can find yourself ahead or behind the yield curve,'' Robert Cole, chief executive officer of New Century, the No. 2 lender to people with the lowest credit scores, said in a Nov. 15 interview in New York. ``With rates going up, it's more likely behind.''
Even if home prices just flatten out, many of these marginal buyers will be in trouble. And the mortgage bond market is reflecting that fear.
Monday, December 05, 2005
Massachusetts: Foreclosure rates on the rise
by Calculated Risk on 12/05/2005 05:32:00 PM
The Sentinel & Enterprise reports: Foreclosure rates on the rise
David Anderson has seen his share of families facing trouble with late bills and expensive mortgages, as a counselor for people about to lose their homes.I think this is key: people are getting in trouble, not because of a personal emergency, but because they are simply over their heads in debt.
But lately Anderson, who works for a Gardner-based Residential Assistance Transitional Housing, got a surprise -- a big jump in foreclosures in the area.
"It used to be that people in foreclosures find themselves in a catastrophic situation, something medical or a losing a job," Anderson said. "But it seems to be now I get a lot of desperate calls from first-time homeowners who have done a 20-80 mortgage or a zero interest mortgage, what some would call predatory lending."
Homeowners across the state are losing their homes at a growing rate, forcing lawmakers to face a hard reality on Beacon Hill -- the state's economy is far from a healthy recovery.
The number of foreclosures in Massachusetts has increased by more than 33 percent in the past year.
...
Economists who spoke to the Sentinel & Enterprise expect the trend to continue as long as the state's economy, particularly job growth, remains sluggish.
"There has been a confluence of events: very slow job growth and higher interest rates, have all conspired to have this one particular result of (more) foreclosures," Nakosteen said.
Bob Forrant, a professor in the regional economic and social development department at UMass Lowell, said foreclosures are on the rise because high real estate prices and loose mortgage requirements clashed with a lack of well-paying jobs in the state.
"The state is not generating enough well-paying work ... and people have been buying more house than they can afford," he said.
...
William Wheaton, an economist and professor at the Massachusetts Institute of Technology in Cambridge, said the spike in foreclosures is "not an economy thing."
"The economy is improving, not very dramatically, but we are on a recovery," Wheaton said.
Wheaton blames the national lending explosion, where more people than ever before had been able to qualify for a mortgage.
"It used to be that you had to have good credit to get a mortgage, but now no matter who you are, you can get a mortgage," he said. "You get a huge number of young people able to buy homes, but they are at a very high risk (of defaulting on loans) ... so the foreclosure rates there will be very high. It won't be getting any better for awhile."
Wheaton also said tougher federal bankruptcy laws, which went into effect in October, will make it harder for people to escape major debt and leave people stranded with high payments and possibly lose their homes.
Demographics and Policy
by Calculated Risk on 12/05/2005 12:26:00 AM
My Angry Bear post builds on my previous demographic posts: The Best of Times. The post includes an enhanced animation of the demographic changes from 1900 to 2050 (based on Census Bureau projections).
Recommended:
Dr. Duy's Fed Watch: Looking for a Reason to Worry ...
And excerpts from Paul Krugman's: Joyless Economy
"It should have been a good year for American families: the economy grew 4.2 percent ... Yet most families actually lost economic ground. Real median household income ... fell for the fifth year in a row. And one key source of economic insecurity got worse, as the number of Americans without health insurance continued to rise. ..."I believe this story of a bifurcating US economy is important. In the roaring 20's many families were struggling because of increased productivity on farms (due to the farm tractor). This shows up in the demographic numbers - the start of the Baby Bust was before the start of the Depression.
The improved farm productivity (a good thing) contributed to a period of depressed wages for a large segment of America (a bad thing) and was a factor in the Great Depression. It really is important that a rising tide floats a vast majority of boats. That didn't happen in the 20's and its not happening now.
Best to all.
Sunday, December 04, 2005
Barrons on Housing
by Calculated Risk on 12/04/2005 09:27:00 PM
Barrons opines on housing (pay):
... the accompanying chart ...[with] that single line rising toward the heavens depicts the share of household real-estate assets as a percentage of gross domestic product. It's a graphic (in every sense of the word) description of the fantastic rise of the housing bubble. ... As David warns, "Caveat emptor whenever anything approaches 150% of GDP."
There are ... any number of reasons to be wary. Among them: Affordability is at a 14-year low; the sales of new and existing homes are leveling off or worse, even as prices continue to rise; inventories of unsold homes are more than ample; mortgage applications are running some 20% below the summer's high; and even a few -- make that a very few -- home builders insist that business is as good as it gets, but could get better.
Moreover, the regulators are growing restless, as they inevitably do when denial can no longer serve as adequate policy to cope with a speculative frenzy that's reaching fever pitch. ... the Comptroller of the Currency, the Fed, the FDIC and their kin who oversee the thrifts and the credit unions are busily drawing up drafts of rules they plan to issue before year-end to seriously tighten standards on risky loans.
Not surprisingly, those risky loans ... are those that cheerfully don't require the consumer to pay down principal; for their part, the originators of such loans ... haven't the foggiest real notion as to whether said consumer can afford the house he's buying. Since these exceedingly risky loans are ... "ubiquitous" a crackdown on them could ... "have a significant impact on the housing market, bank-lending activity and the broader economy, beginning in the first half of next year."
What has made the regulators more than a little antsy is that many of the folks taking interest-only or so-called option adjustable-rate mortgages (ARMs in the popular parlance) are due for brutal "payment shock" when the loans reset, as a heap of them are slated to do over the next several years. Resetting, in this instance, means that the suddenly-not-so-happy home owner, besides higher interest rates, will have to start paying down the principal, a double whammy that could raise his monthly mortgage payments by 50%, even 100%.
Since the bulk of option ARMs and interest-only loans are also "stated income" loans, in which the bank cheerfully accepts as income whatever the borrower says it is and no documentation is required, the shock -- and the consequences -- are sure to be that much greater for the borrower. In the circumstances, lenders might begin to feel a bit queasy as well.
Such risky (to put it mildly) loans, ISI reports, may account for nearly half of all the loans made in the past 18 months...
Saturday, December 03, 2005
Demographics GIF: 1920 - 2005
by Calculated Risk on 12/03/2005 01:20:00 AM
US Population distribution by age, every decade 1920 - 2000, plus 2005.
NOTE: Thanks to InsultComicDog for hosting this animation. Please see previous post for individual graphs.

Friday, December 02, 2005
Demographics: Baby Bust and Boom
by Calculated Risk on 12/02/2005 08:33:00 PM
The following graphs shows the US population distribution by age since 1920.
All data from the Census Bureau.
This is nothing new, but its interesting when considering the debates on Social Security, medical care, budget deficits or when considering investments that are related to demographics (like 2nd homes).
Click on graphs for larger image.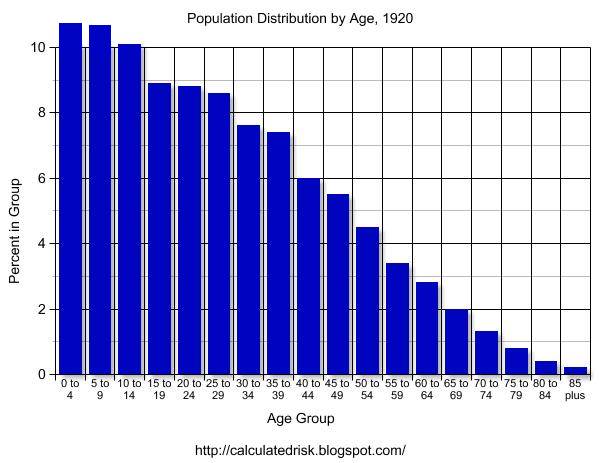
1920 The graphs for 1900 and 1910 have a similar shape as 1920. With the medical advances of the 20th Century, we would expect the shape of the distribution to become flatter as fewer people die of illnesses in the prime of their lives. Otherwise this represents the expected population distribution.
1930 Although 1930 has the general shape of the previous decades, the first evidence of the Baby Bust is apparent. Although 1929 is usually considered the start of the Depression, there was a large segment of America that was struggling economically several years earlier. This shows up in the drop in births.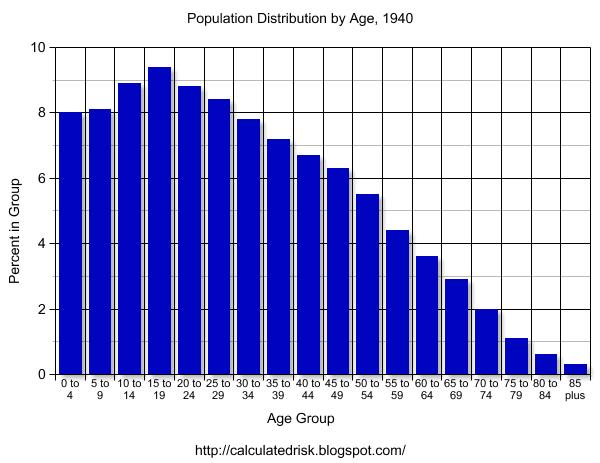
1940 The Depression era Baby Bust is evident in the 1940 census data. With tough economic times, it is no surprise that many families postponed having children.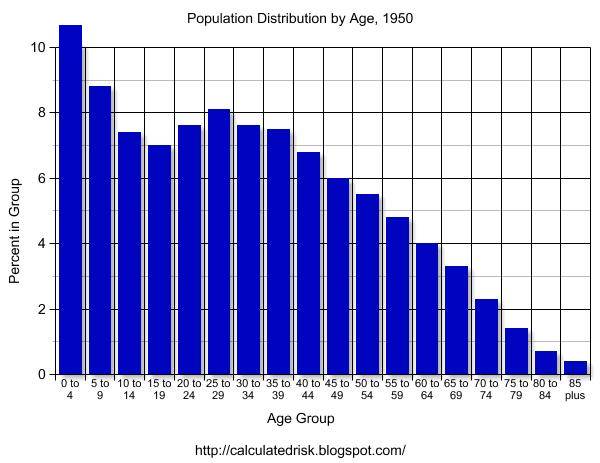
1950 Here comes the Baby Boom. The Boom actually started during World War II and really picked up after the war.
The Baby Bust is very clear on the graph.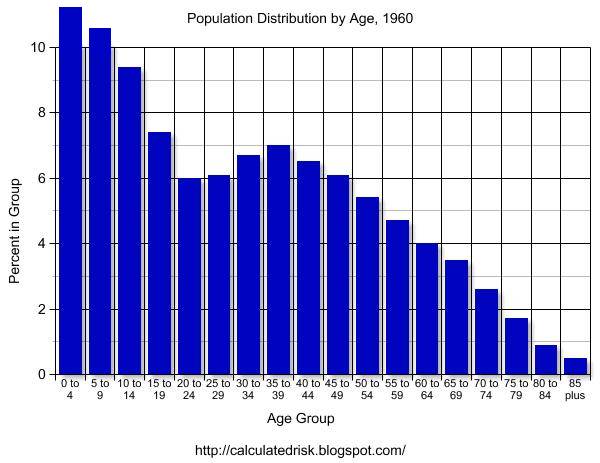
1960 The Baby Boom probably peaked in the mid-1950s.
The 1960 graph clearly shows both the Baby Bust of the '30s and the Baby Boom that followed.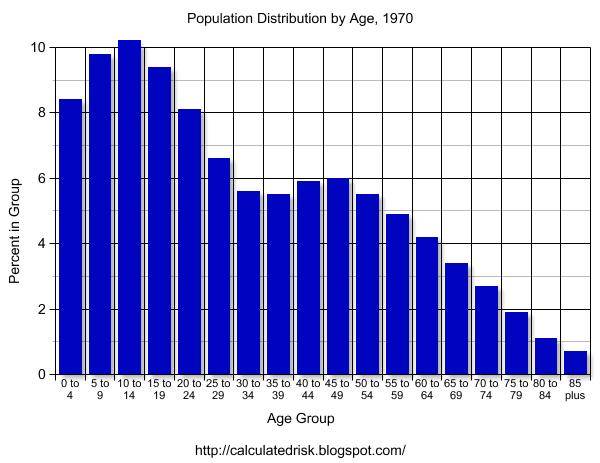
1970 The Baby Boom is over and a mini-bust has started. 
1980 By 1980, the Boomers are mostly in the workforce. Social Security is close to running a deficit and Alan Greenspan heads a commission to fix the program. The Greenspan commission recommends several changes, including having the Baby Boomers prepay their Social Security.
1990 By 1990, the Baby Bust is close to retirement. The Boomers are entering their peak earning years.
This combination of fewer retirees in the '90s (Baby Bust) and Boomers entering their peak earnings years is a positive for running huge Social Security surpluses and working towards balancing the Federal Budget. 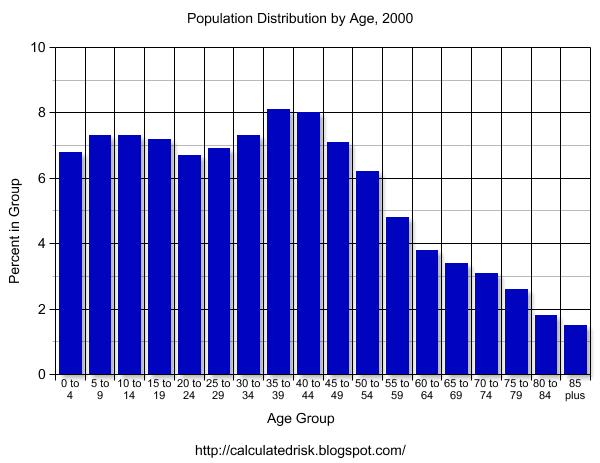
2000 By 2000 it is hard to distinguish the Baby Bust, but the Baby Boom is very clear. New entries into the population have been relatively steady for years. Even with the lower impact from the Baby Bust, medical costs are still straining the budget - and with the Boomers nearing retirement age, this is clearly a major issue for the US.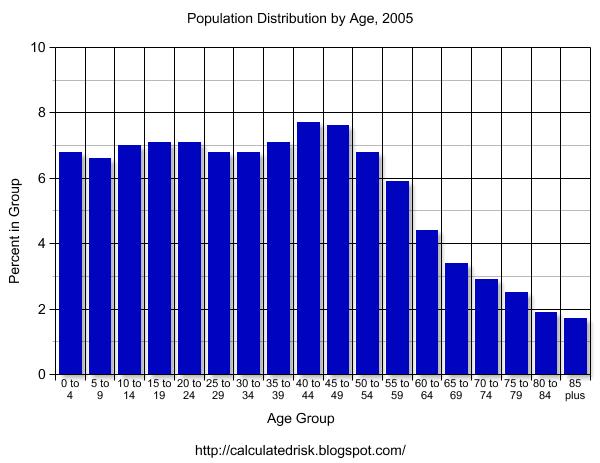
2005 And here is an interim population estimate from the Census Bureau. The distribution is starting to flatten out due to advances in medical care. The largest increases in the distribution have been in the older age groups (compare 2005 to 1920).
I will refer to these graphs in future posts. All comments are welcome.
Fiscal 2006: Record YTD Increase in National Debt
by Calculated Risk on 12/02/2005 01:24:00 PM
Fiscal 2006 is off to a poor start as the increase in the National Debt set a record for the first two months of the fiscal year. The National Debt increased $159.6 Billion to $8.092 Trillion as of Nov 30, 2005. 
Click on graph for larger image.
The previous record through November was in 2004 (fiscal 2005) with an increase in the National Debt of $146.2 Billion.
Each month I will plot the YTD increase in the National Debt and compare it to the proceeding years. I expect fiscal 2006 to set a new record for the annual increase in the National Debt.
Thursday, December 01, 2005
Housing: Remarks by Controller of the Currency
by Calculated Risk on 12/01/2005 09:03:00 PM
John C. Dugan, Controller of the Currency, remarked today on exotic mortgages and the housing market. The first half of his talk, before the Consumer Federation of America, concerned changes to credit card regulations. Here are his remarks (pdf) on negative amortization mortgage products:
"And so, just as we come to the end of the neg am story in credit card lending, I fear we are at the beginning of one in the mass marketing of home mortgages. One of the new “non-traditional” mortgage products you may have heard about is the so-called payment-option ARM – a mortgage that allows borrowers to select from a menu of payment possibilities, ranging from a fully amortizing monthly payment to the neg am payment option that does not cover the outstanding interest. Such products have been available for quite a long time, but until recently had been provided primarily to a narrow group of very creditworthy borrowers who found differing payment options to be an attractive “cash management” tool over time. In this niche market – which is different from the credit card market because of the collateral securing the loan – borrowers have generally had the wherewithal and sophistication to handle temporary periods of negative amortization without jeopardizing their ultimate repayment of principal.
In the last two years, however, we have seen a spike in the volume of payment-option ARMs, which are no longer largely confined to well-heeled borrowers who can clearly afford them. Increasingly, they are being mass marketed as “affordability products” to borrowers who appear to be counting on the fixed period of exceptionally low minimum payments – typically lasting the first five years of the loan – as the primary way to afford the large mortgages necessary to buy homes in many housing markets across the country. And as the loans become more popular, the prospect of using them to penetrate the subprime lending market cannot be far behind.
The fundamental problem with payment option ARMs, other than the growing principal balance due to negative amortization, is payment shock. A traditional 30-year fixed-rate mortgage requires the borrower to amortize the principal balance through equal payments over the 30-year life of the loan. In contrast, a typical payment-option ARM is a 30-year mortgage that permits five years of negative amortization by allowing a borrower to make very low minimum monthly payments during that period. Beginning in the sixth year, the borrower must begin paying the full amount of interest accruing each month, and must also begin amortizing the increased principal over the remaining 25-year life of the loan. The combination of these factors can produce sharply increased payments in year six. For example, a typical payment-option mortgage of $360,000 at 6 percent can produce a monthly payment increase of nearly 50 percent in that year, assuming no change in interest rates. If rates rise to just 8 percent, the payment increase when amortization begins would nearly double.
To the extent that they are planning for such contingencies, many payment-option-ARM borrowers calculate that they will be able to sell their property or refinance the mortgage by year six. But if real estate prices decline – and there already is evidence of softening in some markets – these borrowers could face the bleak prospect of loan balances that exceed the value of the underlying properties. In that case, selling the property or refinancing the loan would not be a viable escape valve for avoiding huge payment shocks.
In these circumstances, do consumers really understand the potential consequences of the neg am feature inherent in a payment-option ARM? Is this an appropriate product to mass market to customers who may be looking at the less than fully amortizing minimum payment as the only way to afford a larger mortgage – at least for the five years before the onset of payment shock? And are lenders really prepared to deal with the consequences – including litigation risk – of providing such products in markets where real estate prices soften or decline, or where interest rates substantially increase?
I fear the answer to all these questions may be “no.” That is one reason why, if all goes according to plan, the Federal banking agencies will propose new guidance with respect to nontraditional mortgage products by the end of this month. While the guidance will cover many other issues besides negative amortization and payment option ARMs, these will certainly be central among the topics addressed. I am mindful of the history of neg am products in credit cards, and I recognize that the nationwide mass marketing of neg am mortgages is in its infancy. As a result, I firmly believe that the guidance should draw clear lines about appropriate standards for qualifying borrowers for payment option ARMs that explicitly take into account potential payment shock. Put another way, lenders should not encourage or accept applications from borrowers who clearly cannot afford the dramatically increased payments that are likely to result at the end of the five-year, low minimum payment period. Disclosures should also be clear, timely, and meaningful. And lenders should have very substantial controls in place to manage the potential risk of such loans."
Quarterly House Appreciation by State
by Calculated Risk on 12/01/2005 03:04:00 PM
In addition to YoY appreciation rates, the OFHEO HPI also presents the quarterly appreciation by state. Every state had positive price increases for Q3 2005.
The worst performing states in Q3 were Michigan (0.89% quarterly increase, 3.6% annual rate) and Kansas (0.94% quarterly increase, 3.8% annual rate).
The best was Arizona (7.3% quarterly increase or a 32.6% annual rate). The following map shows the state by state quarterly appreciation:
Quarterly Appreciation:
Red: Greater than 5%
Dark Orange: 4% to 5%
Light Orange: 3% to 4%
Purple: 2% to 3%
Light Blue: 1% to 2%
Dark Blue: less than 1%
Its important to note these are quarterly rates.
Florida, the DC area and the West Coast continue to see the most price appreciation. Massachusetts has cooled substantially as inventories have increased, although prices still appreciated 1.4% for Q3 (or 5.7% annual rate).
House Price Index Shows 12 Percent Annual Increase
by Calculated Risk on 12/01/2005 10:19:00 AM
The Office of Federal Housing Enterprise Oversight (OFHEO) released (pdf) their Q3 House Price Index this morning.
UPDATE: See Kash's Post: House Prices. Kash breaks the numbers down by some of the hotter markets.
Average U.S. home prices increased 12.02 percent year over year from the third quarter of 2004 through the third quarter of 2005. This represents a two ercentage point decline from the previous four-quarter appreciation rate of approximately 14 percent. Appreciation for the most recent quarter was 2.86 percent. The figures were released today by OFHEO Acting Director Stephen A. Blumenthal, as part of the House Price Index (HPI), a quarterly report analyzing housing price appreciation trends.
“Appreciation rates in the third quarter were extremely strong, although some deceleration can be seen in a number of the faster-appreciating markets,” said OFHEO Chief Economist Patrick Lawler. “Price momentum in the Pacific and New England states, in particular, has pulled back.”
House prices grew more rapidly over the last year than did prices of non-housing goods and services reflected in the Consumer Price Index. House prices rose 12 percent, while prices of other goods and services rose only 4.5 percent.
Appreciation rates in the Pacific Census Division fell from last quarter, but remain higher than in other areas. At slightly less than 16.9 percent, the four-quarter appreciation rate in the South Atlantic Division now trails appreciation in the Pacific by less than one-half a percentage point.
Other significant findings in the HPI:
1. Price growth in Arizona continues to accelerate, with a one-year appreciation rate of 30 percent, the largest of any state by a wide margin.
2. Florida became the second fastest-appreciating state, with four-quarter appreciation of 25 percent and 11 of the 20 highest ranked Metropolitan Statistical Areas (MSAs).
3. Nevada’s four-quarter appreciation rate declined by more than 10 percentage points from the previous rate of 28.6 to 17.6 percent.
4. Two states that continue to show noticeable house price appreciation are Idaho and Utah. Idaho, with an appreciation rate of 15.1 percent on a four-quarter basis, is now ranked 12 among states, up from 20 in the previous HPI report. With annual price growth of 11.4 percent, Utah’s ranking jumped to 22, compared with 31 in the previous HPI report and last place in the fourth quarter of 2003.
5. With a four-quarter appreciation rate of 34.4 percent, Phoenix-Mesa-Scottsdale, AZ topped the list of the fastest appreciating MSAs for the first time since OFHEO began publishing its index in the fourth quarter of 1995. Last quarter’s top MSA, Naples-Marco Island, FL, dropped to number three.
6. For the first time since the fourth quarter of 2003, the list of the Top 20 MSAs having the highest appreciation does not contain any Nevada cities. Reno-Sparks, NV, the fourth ranked market last quarter is now 29 among the 265 ranked MSAs. Also, Las Vegas - Paradise, NV has fallen from 21 to 77, with four-quarter appreciation of 13.77 percent.
“Much of the recent run-up in mortgage rates occurred after the third quarter ended,” said Lawler. “To the extent that those increases may have affected prices, those effects will be evident in future quarters.”
Changes in the mix of data from refinancings and house purchase transactions can affect HPI results. This HPI report includes an index that is calculated using only purchase price data. The index shows an increase of 10.95 percent for the U.S. between the third quarter of 2004 and the third quarter of 2005.


