 RSS Feed
 by Calculated Risk on 5/16/2011 01:47:00 PM
Monday, May 16, 2011
Debt Ceiling: False Comparisons to 1995 / 1996
In discussions of the debt ceiling, I keep seeing comparisons to the 1995/1996 government shutdown (here is an example from the WSJ)
In fiscal 1995, the economy was in the middle of a strong expansion with the unemployment rate around 5.6%. There was no cyclical deficit (from a recession), just a left over structural deficit that was steadily being reduced. The deficit in fiscal 1995 was 2.2% of GDP (about 10.8% of outlays).
This year, the economy is fragile, the unemployment rate is at 9.0%, and the deficit is a combination of both a structural deficit and a cyclical deficit (from the great recession). The total deficit is now close to 9% of GDP and about 37% of outlays.
In fiscal 1995, the government could do the same "extraordinary measures" as today to delay the day of reckoning, and then eventually cut off all non-essential discretionary outlays (the "government shutdown"). That was enough to buy more time, and the government didn't have to default on the debt, or cut Social Security or Medicare payments.
Now there is a cyclical deficit on top of an even larger structural deficit. It is impossible to just shutdown non-essential discretionary outlays - the cuts will have to go deeper. So the comparison isn't valid.
From the numbers, here is the CBO analysis and historical data.
Clearly Stanley Druckenmiller (quoted in the WSJ article) is wrong in assessing the impact by comparing to 1995. Interesting that Mr. Druckenmiller was apparently warning about the long term deficit in the mid-'90s, so I find it strange that there is no mention of his stance on the "surpluses forever" position of Greenspan and the Bush administration in 2001 - since that was a key turning point and led to the large structural deficits. (note: if someone has Druckenmiller's 2001 comments on the deficit, please send them to me).
The good news is the cyclical deficit will decline over the next few years, and (hopefully) be gone by 2015 or so. That will still leave us with the structural deficit - and we will need to address the long term costs of health care - but I think those issues are solvable.
NAHB Builder Confidence index unchanged at low level in May
by Calculated Risk on 5/16/2011 10:00:00 AM
The National Association of Home Builders (NAHB) reports the housing market index (HMI) was unchanged at 16 in May, the same level as in April. This was below expectations for a reading of 17. Confidence remains very low ... any number under 50 indicates that more builders view sales conditions as poor than good.
 Click on graph for larger image in new window.
This graph compares the NAHB HMI (left scale) with single family housing starts (right scale). This includes the May release for the HMI and the March data for starts (April housing starts will be released tomorrow).
Both confidence and housing starts have been moving sideways at a very depressed level for several years.
Press release from the NAHB: Builder Confidence Unchanged in May
Builder confidence in the market for newly built, single-family homes held unchanged at the low level of 16 in May, according to the National Association of Home Builders/Wells Fargo Housing Market Index (HMI), released today. The index has now remained at this level for six out of the past seven months.Builders are still depressed, and the HMI has been below 25 for forty-seven consecutive months - almost 4 years.
...
“The HMI component index measuring traffic of prospective buyers increased by one point for the second time this year as prospective buyers show growing interest but remain extremely hesitant due to a number of factors,” said NAHB Chief Economist David Crowe. “Asked to identify reasons that potential customers are holding back at this time, 90 percent of builders surveyed said clients are concerned about being able to sell their existing home at a favorable price, while 73 percent said consumers think it will be difficult for them to get financing.”
...
Both the index gauging current sales conditions and the index gauging traffic of prospective buyers inched up one point in May, to 16 and 14, respectively. While still very low, the traffic gauge is now at its highest point since May of 2010. Meanwhile, the index gauging sales expectations in the next six months declined two points to 20 in May.
Empire State Manufacturing Survey indicates slower growth in May
by Calculated Risk on 5/16/2011 08:30:00 AM
From the NY Fed: Empire State Manufacturing Survey
The Empire State Manufacturing Survey indicates that conditions for New York manufacturers improved in May, but at a slower pace than in April. The general business conditions index fell ten points to 11.9. The new orders index declined five points to 17.2, and the shipments index slipped three points to 25.8. The inventories index climbed to 10.8, its highest level in a year. The prices paid index rose to 69.9, its highest level since mid-2008, while the prices received index held firm at 28.0. Future indexes continued to convey a high level of optimism about the six-month outlook, although prices are widely expected to rise.This was below expectations of a reading of 20.0. This is the first regional survey released for May and shows that manufacturing is expanding, but at a slower rate.
The index for number of employees inched up to 24.7, indicating that employment levels expanded over the month, and the average workweek index rose thirteen points to 23.7, a multi-year high.
Sunday, May 15, 2011
Residential Remodeling Index increases in March
by Calculated Risk on 5/15/2011 09:45:00 PM
The BuildFax Residential Remodeling Index was at 98.0 in March, up from 95.1 in February. This is based on the number of properties pulling residential construction permits in a given month.
From BuildFax:
The Residential BuildFax Remodeling Index rose 14% year-over-year - and for the seventeenth straight month - in March to 98.0, the highest March number in the index aside from March 2006. Residential remodels in March were up month-over-month 2.9 points (3%) from the February value of 95.1, and up year-over-year 12.0 points from the March 2010 value of 86.0. ...
All regions except the Midwest posted year-over-year and month-over-month gains.
...
According to Joe Masters Emison, vice president of research and development at BuildFax, "Significant improvements in the West continue to drive activity nationally to the best year in remodeling since 2006."
 Click on graph for larger image in graph gallery.
This is the highest level for a March since 2006 - and above the level of 2005 (during the home equity and remodel boom).
Note: permits are not adjusted by value, so this doesn't mean there is more money being spent, just more permit activity. Also some smaller remodeling projects are done without permits and the index will miss that activity.
 Since there is a strong seasonal pattern for remodeling, the second graph shows the year-over-year change from the same month of the previous year.
The remodeling index is up 14% from March 2010.
Although new home construction is still moving sideways, it appears that two other components of residential investment are increasing in 2011: multi-family construction and home improvement (based on this index and reports from home improvement retailers).
Data Source: BuildFax, Courtesy of Index.BuildFax.com
Earlier:
• Summary for Week Ending May 13th
• Schedule for Week of May 15th
• The upward slope of Real House Prices
The upward slope of Real House Prices
by Calculated Risk on 5/15/2011 02:41:00 PM
On Friday, Dave Altig asked Just how out of line are house prices?. Dr. Altig's post featured both a price-to-rent graph and the following real house price graph based on Professor Robert Shiller's work (credits: the graph is from Barry Ritholtz's The Big Picture blog and is an update of a New York Times graphic with a possible projection by Steve Barry).
 Click on graph for larger image in new window.
For the underlying data for the NY Times graphic, please see Professor Shiller's Irrational Exuberance website.
This graph has suggested to many observers that house prices track inflation (i.e. that house price adjusted for inflation are stable - except for bubbles).
I've disagreed with the assertion of stable real prices, and I've argued that "In many areas - if the population is increasing - house prices increase slightly faster than inflation over time, so there is an upward slope for real prices."
 The second graph shows the Professor Shiller real prices and the CoreLogic HPI real prices (adjusted for CPI just like Shiller).
It is important to realize that Professor Shiller used the quarterly Case-Shiller National index starting in 1987. From 1975 through 1986 he used what is now called the FHFA index. He used other price indexes in earlier periods.
The FHFA index was based on a small percentage of transactions back in the '70s. If we look at the CoreLogic index instead, there is a clear upward slope to real house prices.
If Professor Shiller had used the Freddie Mac quarterly index back to 1970 (instead of the PHCPI), there would be more of an upward slope to his graph too. So it is important to understand that for earlier periods the data is probably less accurate.
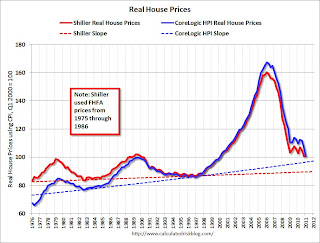 The third graph shows the upward slope for both real price indexes. Even the Shiller Irrational Exuberance real price index has an upward slope - and the CoreLogic upward slope is steeper.
Sure - house prices could overshoot to the downside. But the projection on the first graph of close to 25% in further real price declines is probably excessive. Right now the real CoreLogic HPI is less than 5% above the trend line (it could overshoot), and the Case-Shiller national index will probably decline sharply in Q1 too and not be far above the trend line.
So - back to Dr. Altig's post - I don't think we have to choose between real prices and price-to-rent graphs to ask "how far out of line are house prices?" I think they are both showing that prices are not far above the historical lows. Prices might overshoot to the downside because of supply and demand issues; there is a large overhang of vacant housing units and many distressed properties still coming on the market, plus demand is soft with weak employment, fairly tight financing, negative home buying sentiment and some usual buyers excluded because of credit issues. But I don't think national real prices are that far out of line.
Note: usually near the end of a housing bust - after nominal prices stop falling - real prices decline slowly for a couple more years, and we will probably see that this time too. Of course, right now, nominal prices are still falling.
Earlier:
• Summary for Week Ending May 13th
• Schedule for Week of May 15th
Schedule for Week of May 15th
by Calculated Risk on 5/15/2011 09:01:00 AM
Earlier:
• Summary for Week Ending May 13th
Three key housing reports will be released this week: May homebuilder confidence on Monday, April housing starts on Tuesday, and April existing home sales on Wednesday.
There will also be three manufacturing reports released: the NY and Philly Fed manufacturing surveys for May, and Industrial Production and Capacity Utilization for April. Last month there was some concern that growth in manufacturing was slowing, and these surveys will provide an early hint for activity in May.
8:30 AM ET: NY Fed Empire Manufacturing Survey for May. The consensus is for a reading of 20.0, down slightly from 21.7 in April.
9:00 AM: Speech, Fed Chairman Ben Bernanke, "Innovation, Research, and Development: The Government's Role", At the Conference on "New Building Blocks for Jobs and Economic Growth", Washington, D.C.
10 AM: The May NAHB homebuilder survey. The consensus is for a reading of 17, up slightly from 16 in April. Any number below 50 indicates that more builders view sales conditions as poor than good. This index has been below 25 for forty six consecutive months (almost 4 years).
8:30 AM: Housing Starts for April. After collapsing following the housing bubble, housing starts have mostly moved sideways at a very depressed level for over two years.
 Click on graph for larger image in graph gallery.
This graph shows total and single unit starts since 1968.
Total housing starts were at 549 thousand (SAAR) in March, up 7.2% from the revised February rate of 512 thousand (revised up from 479 thousand). Single-family starts increased 7.7% to 422 thousand in March (February was revised up to 392 thousand from 375 thousand).
The consensus is for an increase to 570,000 (SAAR) in April.
9:15 AM ET: The Fed will release Industrial Production and Capacity Utilization for April.
 This graph shows industrial production since 1967. Industrial production increased in March to 93.6, however February was revised down from 93.0 to 92.8. Production is still 7.0% below the pre-recession levels at the end of 2007.
 The consensus is for a 0.4% increase in Industrial Production in April, and an increase to 77.6% (from 77.4%) for Capacity Utilization.
Early: The AIA's Architecture Billings Index for April (a leading indicator for commercial real estate).
 This graph shows the Architecture Billings Index since 1996. The index showed billings increased slightly in March (index at 50.5, anything above indicates an increase in billings).
This index usually leads investment in non-residential structures (hotels, malls, office) by 9 to 12 months.
7:00 AM: The Mortgage Bankers Association (MBA) will release the mortgage purchase applications index. This index has been very weak over the last couple months suggesting weak home sales through mid-year (not counting all cash purchases).
2:00 PM: FOMC Minutes, Meeting of April 26-27, 2011. The minutes were overshadowed by Fed Chairman Bernanke’s press conference and the previous release of the updated forecasts.
8:30 AM: The initial weekly unemployment claims report will be released. The number of claims has increased over the last few weeks. The consensus is for a decrease to 420,000 from 434,000 last week.
8:30 NY Fed President William Dudley speaks, “The US Economic Outlook — Where Are We Headed”, New Paltz, NY
10:00 AM: Mortgage Bankers Association (MBA) 1st Quarter 2011 National Delinquency Survey (NDS)
10:00 AM: Philly Fed Survey for May. The consensus is for an increase to 20.0, up from the 18.5 last month.
10:00 AM: Conference Board Leading Indicators for April. The consensus is for a 0.1% increase for this index.
10:00 AM: Existing Home Sales for April from the National Association of Realtors (NAR). The consensus is for sales of 5.2 million at a Seasonally Adjusted Annual Rate (SAAR) in April, up about 2% from the 5.10 million SAAR in March.
 This graph shows existing home sales, on a Seasonally Adjusted Annual Rate (SAAR) basis since 1993. Sales in March 2011 (5.10 million SAAR) were 3.7% higher than in February, and were 6.3% lower than March 2010.
 In addition to sales, the level of inventory and months-of-supply will be very important (since months-of-supply impacts prices).
10:00 AM: Regional and State Employment and Unemployment for April 2011
Best wishes to All!


