 RSS Feed
 by Calculated Risk on 10/29/2010 09:55:00 AM
Friday, October 29, 2010
Chicago PMI increases, Consumer Sentiment weak
Two stories ...
From the Institute for Supply Management – Chicago: The overall index increased to 60.6 vs 60.4. Note: any number above 50 shows expansion. Employment index increased to 54.6 from 53.4 in September. The new orders index increased to 65.0 from 61.4.
Overall this was a positive report. The national ISM manufacturing index will be released on Monday.
From MarketWatch: Consumer sentiment falls in October to 67.7
 Click on graph for larger image in new window.
This was a big story in July when consumer sentiment collapsed. Sentiment in October was slightly below the level in July - and this is the lowest level since late 2009.
Consumer sentiment is a coincident indicator and reflects the weak economy.
Q3 Advance Report: Real Annualized GDP Grew at 2.0%
by Calculated Risk on 10/29/2010 08:30:00 AM
Real gross domestic product -- the output of goods and services produced by labor and property located in the United States -- increased at an annual rate of 2.0 percent in the third quarter of 2010, (that is, from the second quarter to the third quarter), according to the "advance" estimate released by the Bureau of Economic Analysis.
 Click on graph for larger image in new window.
This graph shows the quarterly GDP growth (at an annual rate) for the last 30 years. The dashed line is the median growth rate of 3.05%. The current recovery is very weak - the 2nd half slowdown continues.
A few key numbers:
Without the boost in inventories, GDP would have been barely positive in Q3.
This was a little stronger than expected, and PCE will probably slow over the next couple of quarters.
As expected, residential investment declined sharply after the Q2 tax credit boost.
Overall this was a weak report and will not derail QE2 next wednesday (further easing from the Fed).
Thursday, October 28, 2010
Foreclosure-Gate: Title Insurers Drop Demands
by Calculated Risk on 10/28/2010 09:49:00 PM
From Elizabeth Razzi at the WaPo: Title insurers drop demands on mortgage lenders in foreclosure cases
Three major title insurance companies - First American Financial, Old Republic International and Stewart Information Services - told Wall Street analysts in conference calls Thursday that they had decided not to demand written indemnifications from lenders re-selling foreclosed homes. Combined, the three companies account for 52 percent of the title insurance market.This is means that the buyers of REO (lender Real Estate Owned) will be able to obtain title insurance, and that the new owner can sell the property. There was some concern that buyers would shy away from REOs.
House Prices have corrected to what year?
by Calculated Risk on 10/28/2010 05:45:00 PM
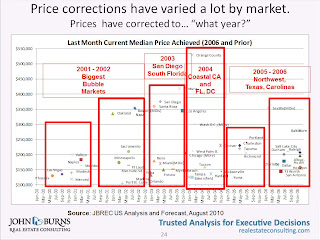
Housing consultant John Burns presented this slide as part of the UCLA Anderson Forecast this week:
 Click on graph for larger image in new window.
John Burns used median prices for this slide. It shows that the "biggest bubble markets" are back to 2000 to 2002 median prices, whereas some areas are still at 2006 prices.
And here is a timeline for the 20 Case-Shiller cities:
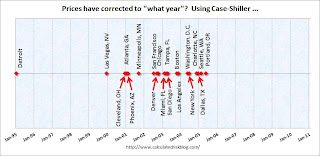 There is no y-axis because this is based on a price index (not median prices).
Detroit is back to 1995 prices, and some cities like Dallas, Portland and Seattle are only back to 2005 or 2006 prices (the bubble arrived later in the Northwest).
Housing Bust impacting Manager Mobility
by Calculated Risk on 10/28/2010 02:31:00 PM
From Challenger, Gray & Christmas: Job Seeker Relocation Drops to Record Low
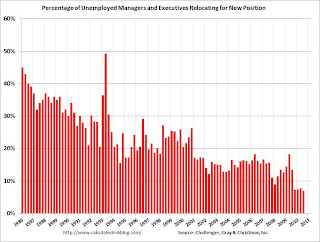
The percentage of unemployed managers and executives relocating for a new position fell to a record low in the third quarter of 2010, as a slightly improved job market and greatly depreciated home values combined to eliminate this option for most job seekers.
Just 6.9 percent of job seekers who found employment in the third quarter relocated for the new position. That was down from a relocation rate of 13.4 percent in the same quarter a year ago ...
“Continued weakness in the housing market is undoubtedly the biggest factor suppressing relocation. Job seekers who own a home – even if they are open to relocating for a new job – are basically stuck where they are if they are unable or unwilling to sell their homes without incurring a significant loss,” said John A. Challenger, chief executive officer of Challenger, Gray & Christmas.
 Click on graph for larger image in new window.
Here is the quarterly data from Challenger, Gray. Mobility has been trending down for some time, but really declined over the last year.
It is tough to move when you can't sell your home. Sometimes the new employer will pick up the short fall for key executives and managers, but it is probably too expensive in many cases now.
This is no surprise. Here is what I wrote in 2007:
Less worker mobility [due to negative equity] is kind of like arteriosclerosis of the economy. It lowers the overall growth potential.One of the strengths of the U.S. labor market has been the flexibility associated with labor mobility at all levels of employment - households could easily move from one region to another for better employment. The sharp decline in house prices, leaving homeowners with significant negative equity, appears to be limiting this flexibility.
Perhaps as many as 15 to 20 million households will be saddled with negative equity by 2009. Even if most of these homeowners don't "walk away", there might still be a negative impact on the economy due to less worker mobility.
Update: PIMCO's Bill Gross has called end of bond rally before
by Calculated Risk on 10/28/2010 01:42:00 PM
Yesterday I mentioned that Bill Gross was calling the end "of a great 30-year bull market in bonds". I thought he was changing his view, but this isn't the first time (ht Erik):
From Bloomberg on March 27, 2010: Pimco’s Bill Gross Says Bonds Have Seen Best Days
“Bonds have seen their best days,” Gross said in a Bloomberg Radio interview ... Yields on two-year U.S. Treasury notes are likely to rise to 1.25 percent to 1.5 percent from 1.08 percent in the next year as the economy strengthens and the Federal Reserve begins to increase interest rates, Gross said.On March 26, 2010 the Ten Year Treasury yield was 3.86% (now 2.65%)
And from Reuters in June 2007: Pimco's Gross says he's now a "bear market manager"
Gross forecast that benchmark Treasury yields will range higher than previously thought, prompting him to acknowledge he is now a "bear market manager" after a quarter of a century as the global bond market's most powerful bull.On June 7, 2007, the ten year Treasury yield was 5.1%.
So Gross has called the end of the bond rally before. Nevermind.
The end of the "bull market in bonds" really depends on if the economy strengthens, and I don't see a pickup in economic growth any time soon.


