 RSS Feed
 by Calculated Risk on 9/20/2010 11:31:00 AM
Monday, September 20, 2010
NBER: Recession ended in June 2009
From NBER: NBER Business Cycle Dating Committee Announces Trough Date
The Business Cycle Dating Committee of the National Bureau of Economic Research ... determined that a trough in business activity occurred in the U.S. economy in June 2009. The trough marks the end of the recession that began in December 2007 and the beginning of an expansion. The recession lasted 18 months, which makes it the longest of any recession since World War II.This is somewhat subjective - and I thought they'd wait longer because the committee usually waits until some of the key indicators have returned to pre-recession levels. This time no indicator has reached the pre-recession level, and some are still very low (like personal income less transfer payments).
In determining that a trough occurred in June 2009, the committee did not conclude that economic conditions since that month have been favorable or that the economy has returned to operating at normal capacity. Rather, the committee determined only that the recession ended and a recovery began in that month. A recession is a period of falling economic activity spread across the economy, lasting more than a few months, normally visible in real GDP, real income, employment, industrial production, and wholesale-retail sales. The trough marks the end of the declining phase and the start of the rising phase of the business cycle. Economic activity is typically below normal in the early stages of an expansion, and it sometimes remains so well into the expansion.
The committee decided that any future downturn of the economy would be a new recession and not a continuation of the recession that began in December 2007. The basis for this decision was the length and strength of the recovery to date.
NAHB Builder Confidence stuck at low level in September
by Calculated Risk on 9/20/2010 10:00:00 AM
The National Association of Home Builders (NAHB) reports the housing market index (HMI) was at 13 in September. This is the same low level as in August and below expectations. The record low was 8 set in January 2009, and 13 is very low ...
Note: any number under 50 indicates that more builders view sales conditions as poor than good. Click on graph for larger image in new window.
This graph compares the NAHB HMI (left scale) with single family housing starts (right scale). This includes the September release for the HMI and the July data for starts (August starts will be released tomorrow).
This shows that the HMI and single family starts mostly move in the same direction - although there is plenty of noise month-to-month.
Press release from the NAHB: Builder Confidence Unchanged in September
Builder confidence in the market for newly built, single-family homes held unchanged in September from the previous month's low level of 13, according to the latest National Association of Home Builders/Wells Fargo Housing Market Index (HMI), released today.
"In general, builders haven't seen any reason for improved optimism in market conditions over the past month," noted NAHB Chairman Bob Jones, a home builder from Bloomfield Hills, Mich. "If anything, consumer uncertainty has increased, and builders feel their hands are tied until potential home buyers feel more secure about the job market and economy."
"The stall in the nation's housing market continues," agreed NAHB Chief Economist David Crowe. "Builders report that the two leading obstacles to new-home sales right now are consumer reluctance in the face of the poor job market and the large number of foreclosed properties for sale."
Over 50 and Unemployed: Will they ever work again?
by Calculated Risk on 9/20/2010 08:33:00 AM
From Mokoto Rich at the NY Times: For the Unemployed Over 50, Fears of Never Working Again (ht Ann)
Of the 14.9 million unemployed, more than 2.2 million are 55 or older. Nearly half of them have been unemployed six months or longer, according to the Labor Department. The unemployment rate in the group — 7.3 percent — is at a record, more than double what it was at the beginning of the latest recession.It is hard for people in their 50s to change careers, or rebuild their savings after a long period of unemployment. And, as in the story, they may end up taking Social Security early - just to get by - and that means they will receive a significantly lower monthly payout than if they waited until 66. A very tough situation.
After other recent downturns, older people who lost jobs fretted about how long it would take to return to the work force and worried that they might never recover their former incomes. But today, because it will take years to absorb the giant pool of unemployed at the economy’s recent pace, many of these older people may simply age out of the labor force before their luck changes.
Sunday, September 19, 2010
FT: Junk bond prices hit pre-crisis levels
by Calculated Risk on 9/19/2010 08:47:00 PM
From the Financial Times: Junk bond prices hit pre-crisis levels
Strong investor demand for junk bonds has pushed the average price on such corporate debt to its highest level since June 2007, when companies could borrow with ease at the height of the credit boom.And from the WSJ: Bond Markets Get Riskier
except with permission
Bond markets are growing riskier as investors seeking steady returns bid up prices and ignore some early warning signs similar to those that flashed during the credit bubble.This seems like investors chasing yield - and that is making it easy to sell junk bonds. Oh well ...
Last week, prices on high-yield, or junk, bonds, hit their highest level since 2007, nearly double their lows of the credit crisis. Nine months into the year, companies have sold $172 billion in junk bonds, already an annual record, according to data provider Dealogic.
Weekly Schedule for September 19th
by Calculated Risk on 9/19/2010 02:45:00 PM
Note: The previous post is a summary of last week with graphs.
Four key housing reports will be released this week: the September homebuilder confidence survey (Monday), August housing starts (Tuesday), August existing home sales (Thursday), and August new home sales (Friday). Also the FOMC meets on Tuesday.
Making Home Affordable Program (HAMP) for August and the “Housing Scorecard”
Moody's/REAL Commercial Property Price Index (CPPI) for July.
10 AM: The September NAHB homebuilder survey. This index collapsed following the expiration of the home buyer tax credit. The consensus is for a slight increase to 14 from 13 in August (still very depressed).
8:30 AM: Housing Starts for August. Housing starts also collapsed following the expiration of the home buyer tax credit. The consensus is for a slight increase to 550K (SAAR) in August from 546K in July.
10:00 AM: the BLS will release the Regional and State Employment and Unemployment report for August.
2:15 PM: The FOMC statement will be released. I don't expect any significant changes to the statement compared to the statement following the August meeting.
Early: The AIA's Architecture Billings Index for August will be released (a leading indicator for commercial real estate). This has been showing ongoing contraction, and usually this leads investment in non-residential structures (hotels, malls, office) by 9 to 12 months.
7:00 AM: The Mortgage Bankers Association (MBA) will release the mortgage purchase applications index. This index declined sharply following the expiration of the tax credit, and the index has only recovered slightly over the last couple months - suggesting reported home sales through at least October will be very weak.
10:00 AM: 10:00 FHFA House Price Index for July. This is based on GSE repeat sales and is no longer as closely followed as Case-Shiller (or CoreLogic).
8:30 AM: The initial weekly unemployment claims report will be released. Consensus is for about the same as last week (450 thousand).
10:00 AM: Existing Home Sales for August from the National Association of Realtors (NAR). The consensus is for an increase to 4.1 million (SAAR) in August from 3.83 million in July. Housing economist Tom Lawler is projecting 4.1 million SAAR. In addition to sales, the level of inventory and months-of-supply will be very important (since months-of-supply impacts prices).
10:00 AM: Conference Board's index of leading indicators for August. The consensus is for a 0.1% increase in this index.
1:00 PM ET: Former Fed Chairman Paul A. Volcker gives the Keynote address at the Chicago Fed and IMF Thirteenth Annual International Banking Conference
8:30 AM: Durable Goods Orders for August from the Census Bureau. The consensus is for a 1.0% decline in durable good orders.
10:00 AM: New Home Sales for August from the Census Bureau. The consensus is for a slight increase in sales to 290K (SAAR) in August from 276K in July.
1:00 PM: Richmond Fed President Jeffrey Lacker speaks on the economic outlook at the 2010 Kentucky Economic Association Annual Conference
4:30 PM: Fed Chairman Ben Bernanke speaks at the Conference Co-sponsored by the Center for Economic Policy Studies and the Bendheim Center for Finance, Princeton University, Princeton, N.J: "Implications of the Financial Crisis for Economics"
After 4:00 PM: The FDIC will probably have another busy Friday afternoon ...
Summary for week ending Sept 18th
by Calculated Risk on 9/19/2010 10:30:00 AM
A summary of last week - mostly in graphs:
From the Fed: Industrial production and Capacity Utilization
Industrial production rose 0.2 percent in August after a downwardly revised increase of 0.6 percent in July [revised down from 1.0 percent]. ... The capacity utilization rate for total industry rose to 74.7 percent, a rate 4.7 percentage points above the rate from a year earlier and 5.9 percentage points below its average from 1972 to 2009.
 Click on graph for larger image in new window.
This graph shows Capacity Utilization. This series is up 9.6% from the record low set in June 2009 (the series starts in 1967).
Capacity utilization at 74.7% is still far below normal - and well below the the pre-recession levels of 81.2% in November 2007. (Note: this is actual a decrease before the revision to July)
Note: y-axis doesn't start at zero to better show the change.
 The second graph shows industrial production since 1967.
This is the highest level for industrial production since Oct 2008, but production is still 7.2% below the pre-recession levels at the end of 2007.
The increase in August was about consensus, however the sharp downward revision to July puts this below consensus.
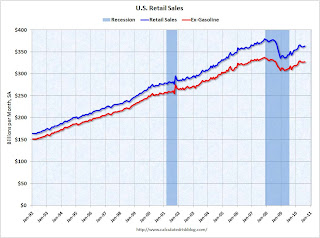 On a monthly basis, retail sales increased 0.4% from July to August (seasonally adjusted, after revisions), and sales were up 3.6% from August 2009. Retail sales increased 0.6% ex-autos.
 This graph shows retail sales since 1992. This is monthly retail sales, seasonally adjusted (total and ex-gasoline).
Retail sales are up 8.4% from the bottom, but still off 4.3% from the pre-recession peak.
Retail sales are still below the April level - and have mostly moved sideways for six months.
From CoreLogic: CoreLogic Home Price Index Remained Flat in July
 This graph shows the national CoreLogic HPI data since 1976. January 2000 = 100.
The index is flat over the last year, and off 28% from the peak.
The index is 6.1% above the low set in March 2009, and I expect to see a new post-bubble low for this index later this year or early in 2011.
 Press Release: August PCI Decline Signals Struggling Economy, but no Double-Dip
This graph shows the index since January 1999.
This is a new index, and doesn't have much of a track record in real time, although the data appears to suggest that the recovery has slowed - even stalled - over the last 4 months.
The Cleveland Fed has released the median CPI:
According to the Federal Reserve Bank of Cleveland, the median Consumer Price Index rose 0.1% (0.6% annualized rate) in August. The 16% trimmed-mean Consumer Price Index increased 0.1% (1.2% annualized rate) during the month.
...
Over the last 12 months, the median CPI rose 0.5%, the trimmed-mean CPI rose 0.9%, the CPI rose 1.1%, and the CPI less food and energy rose 0.9%.
 Click on graph for larger image in new window.
This graph shows three measure of inflation, Core CPI, Median CPI (from the Cleveland Fed), and 16% trimmed CPI (also from Cleveland Fed).
They all show that inflation has been falling, and that measured inflation is up less than 1% year-over-year. Core CPI was flat, and median CPI and the 16% trimmed mean CPI were up 0.1% in August.
Best wishes to all.


