 RSS Feed
 by Calculated Risk on 9/19/2010 10:30:00 AM
Sunday, September 19, 2010
Summary for week ending Sept 18th
A summary of last week - mostly in graphs:
From the Fed: Industrial production and Capacity Utilization
Industrial production rose 0.2 percent in August after a downwardly revised increase of 0.6 percent in July [revised down from 1.0 percent]. ... The capacity utilization rate for total industry rose to 74.7 percent, a rate 4.7 percentage points above the rate from a year earlier and 5.9 percentage points below its average from 1972 to 2009.
 Click on graph for larger image in new window.
This graph shows Capacity Utilization. This series is up 9.6% from the record low set in June 2009 (the series starts in 1967).
Capacity utilization at 74.7% is still far below normal - and well below the the pre-recession levels of 81.2% in November 2007. (Note: this is actual a decrease before the revision to July)
Note: y-axis doesn't start at zero to better show the change.
 The second graph shows industrial production since 1967.
This is the highest level for industrial production since Oct 2008, but production is still 7.2% below the pre-recession levels at the end of 2007.
The increase in August was about consensus, however the sharp downward revision to July puts this below consensus.
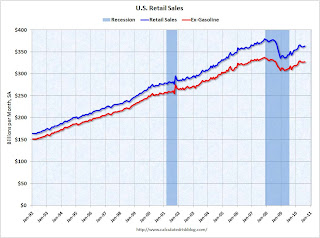 On a monthly basis, retail sales increased 0.4% from July to August (seasonally adjusted, after revisions), and sales were up 3.6% from August 2009. Retail sales increased 0.6% ex-autos.
 This graph shows retail sales since 1992. This is monthly retail sales, seasonally adjusted (total and ex-gasoline).
Retail sales are up 8.4% from the bottom, but still off 4.3% from the pre-recession peak.
Retail sales are still below the April level - and have mostly moved sideways for six months.
From CoreLogic: CoreLogic Home Price Index Remained Flat in July
 This graph shows the national CoreLogic HPI data since 1976. January 2000 = 100.
The index is flat over the last year, and off 28% from the peak.
The index is 6.1% above the low set in March 2009, and I expect to see a new post-bubble low for this index later this year or early in 2011.
 Press Release: August PCI Decline Signals Struggling Economy, but no Double-Dip
This graph shows the index since January 1999.
This is a new index, and doesn't have much of a track record in real time, although the data appears to suggest that the recovery has slowed - even stalled - over the last 4 months.
The Cleveland Fed has released the median CPI:
According to the Federal Reserve Bank of Cleveland, the median Consumer Price Index rose 0.1% (0.6% annualized rate) in August. The 16% trimmed-mean Consumer Price Index increased 0.1% (1.2% annualized rate) during the month.
...
Over the last 12 months, the median CPI rose 0.5%, the trimmed-mean CPI rose 0.9%, the CPI rose 1.1%, and the CPI less food and energy rose 0.9%.
 Click on graph for larger image in new window.
This graph shows three measure of inflation, Core CPI, Median CPI (from the Cleveland Fed), and 16% trimmed CPI (also from Cleveland Fed).
They all show that inflation has been falling, and that measured inflation is up less than 1% year-over-year. Core CPI was flat, and median CPI and the 16% trimmed mean CPI were up 0.1% in August.
Best wishes to all.


