 RSS Feed
 by Calculated Risk on 9/02/2010 08:30:00 AM
Thursday, September 02, 2010
Weekly initial unemployment claims decline slightly
The DOL reports on weekly unemployment insurance claims:
In the week ending Aug. 28, the advance figure for seasonally adjusted initial claims was 472,000, a decrease of 6,000 from the previous week's revised figure of 478,000. The 4-week moving average was 485,500, a decrease of 2,500 from the previous week's revised average of 488,000.
 Click on graph for larger image in new window.
This graph shows the 4-week moving average of weekly claims since January 2000.
The dashed line on the graph is the current 4-week average. The four-week average of weekly unemployment claims decreased this week by 2,500 to 485,500.
Claims for last week were revised up from 473,000 to 478,000. So the level this week is about the same as initially reported last week.
The current level of the 4-week average suggests a weak job market.
Wednesday, September 01, 2010
Personal Bankruptcy Filings: Down from July, Up from August 2009
by Calculated Risk on 9/01/2010 06:54:00 PM
Note: The number of filings is volatile month to month - and August is frequently a bit lower than July.
From the American Bankruptcy Institute: August Consumer Bankruptcy Filings fall 8 Percent this Month
The 127,028 consumer bankruptcies filed in August represented a 8 percent decrease nationwide over the 137,698 filings recorded in July 2010, according to the American Bankruptcy Institute (ABI), relying on data from the National Bankruptcy Research Center (NBKRC). Though a decrease from the previous month, NBKRC’s data also showed that the August 2010 consumer filings represented a 6 percent increase from the 119,874 consumer filings recorded in August 2009. ...
“While monthly filings are volatile, consumer bankruptcies are still the highest they have been since Congress overhauled the bankruptcy law in 2005,” said ABI Executive Director Samuel J. Gerdano. “Consumer filings remain on track to top 1.6 million filings in 2010.”
 Click on graph for larger image in new window.
This graph shows the non-business bankruptcy filings by quarter using monthly data from the ABI and previous quarterly data from USCourts.gov.
In 2005 the so-called "Bankruptcy Abuse Prevention and Consumer Protection Act of 2005" was enacted. Since then the number of bankruptcy filings has increased steadily.
U.S. Light Vehicle Sales 11.5 Million SAAR in August
by Calculated Risk on 9/01/2010 04:00:00 PM
Based on an estimate from Autodata Corp, light vehicle sales were at a 11.47 million SAAR in August. That is down 18.9% from August 2009 (cash-for-clunkers), and down 0.5% from the July sales rate. Click on graph for larger image in new window.
This graph shows the historical light vehicle sales (seasonally adjusted annual rate) from the BEA (blue) and an estimate for August (red, light vehicle sales of 11.47 million SAAR from Autodata Corp).
The high for the year was in March, and sales have moved mostly sideways since then. The second graph shows light vehicle sales since the BEA started keeping data in 1967.
Note: dashed line is current month sales rate. The current sales rate is still below the bottom of the '90/'91 recession - when there were fewer registered drivers and a smaller population.
This was below most forecasts of around 11.6 million SAAR.
Some comments on August ISM Manufacturing Index
by Calculated Risk on 9/01/2010 12:15:00 PM
The Institute for Supply Management reported this morning that the PMI increased to 56.3 from 55.5 in July. Expectations were for a decrease to 53.0. Click on graph for larger image in new window.
Here is an update to the graph showing the regional Fed manufacturing surveys and the ISM index through August.
The Fed surveys suggested that the ISM index would probably decline, but the relationship is noisy. Based on this graph I'd expect either the Fed surveys to bounce back in September - or the ISM to decline. Here is a long term graph that hopefully puts the uptick in August in perspective.
In addition to the increase in the PMI, the production index increased to 59.9 from 57.0, and the employment index increased from 58.6 in July to 60.4. That suggests increased manufacturing employment in August.
However the new orders index declined in August to 53.1 from 53.5 in July (still expanding, but at a slower pace). And the inventory index was up for the 2nd month in a row to 51.4.
This report was somewhat better than expected, but I still expect the index to decline over the next couple of months.
General Motors: Sales off sharply from August 2009
by Calculated Risk on 9/01/2010 11:18:00 AM
Note: Sales in August 2009 were boosted by "Cash-for-clunkers".
From MarketWatch: GM August U.S. sales down 24.9% to 185,176 units
General Motors Co. said Wednesday that U.S. sales in August slumped 24.9% to 185,176 vehicles from 246,479 in August 2009.Note: in August 2009 U.S. light vehicle sales were 14.1 million (SAAR). This was related to "Cash-for-clunkers" - also General Motors emerged from bankruptcy on July 10, 2009.
I'll add reports from the other major auto companies as updates to this post.
Update1: From MarketWatch: Ford U.S. August sales slide 10.7% to 157,503
From MarketWatch: Chrysler U.S. August sales rise 7% to 99,611 units
NOTE: Once all the reports are released, I'll post a graph of the estimated total August light vehicle sales (SAAR: seasonally adjusted annual rate) - usually around 4 PM ET. Most estimates are for an increase to 11.6 million SAAR in August from the 11.5 million SAAR in July.
Construction Spending declines in July
by Calculated Risk on 9/01/2010 10:15:00 AM
Note: the ISM PMI increased to 56.3 from 55.5 in July (I'll have more later).
Overall construction spending decreased in July.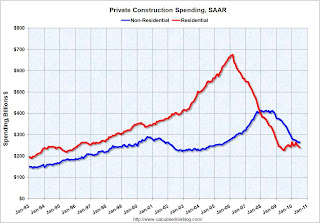 Click on graph for larger image in new window.
This graph shows private residential and nonresidential construction spending since 1993. Note: nominal dollars, not inflation adjusted.
From the Census Bureau: July 2010 Construction at $805.2 Billion Annual Rate
The U.S. Census Bureau of the Department of Commerce announced today that construction spending during July 2010 was estimated at a seasonally adjusted annual rate of $805.2 billion, 1.0 percent (±1.4%)* below the revised June estimate of $813.1 billion. The July figure is 10.7 percent (±1.8%) below the July 2009 estimate of $901.2 billion.Private residential construction spending has turned down again - after the tax credit expired - and residential investment (RI) will be a drag on Q3 GDP. The "good" news is the overall drag from RI will be much smaller than during 2006, 2007 and 2008.
...
Spending on private construction was at a seasonally adjusted annual rate of $506.4 billion, 0.8 percent (±1.3%)* below the revised June estimate of $510.7 billion. Residential construction was at a seasonally adjusted annual rate of $240.3 billion in July, 2.6 percent (±1.3%) below the revised June estimate of $246.7 billion. Nonresidential construction was at a seasonally adjusted annual rate of $266.1 billion in July, 0.8 percent (±1.3%)* above the revised June estimate of $264.0billion.


