 RSS Feed
 by Calculated Risk on 9/01/2010 11:18:00 AM
Wednesday, September 01, 2010
General Motors: Sales off sharply from August 2009
Note: Sales in August 2009 were boosted by "Cash-for-clunkers".
From MarketWatch: GM August U.S. sales down 24.9% to 185,176 units
General Motors Co. said Wednesday that U.S. sales in August slumped 24.9% to 185,176 vehicles from 246,479 in August 2009.Note: in August 2009 U.S. light vehicle sales were 14.1 million (SAAR). This was related to "Cash-for-clunkers" - also General Motors emerged from bankruptcy on July 10, 2009.
I'll add reports from the other major auto companies as updates to this post.
Update1: From MarketWatch: Ford U.S. August sales slide 10.7% to 157,503
From MarketWatch: Chrysler U.S. August sales rise 7% to 99,611 units
NOTE: Once all the reports are released, I'll post a graph of the estimated total August light vehicle sales (SAAR: seasonally adjusted annual rate) - usually around 4 PM ET. Most estimates are for an increase to 11.6 million SAAR in August from the 11.5 million SAAR in July.
Construction Spending declines in July
by Calculated Risk on 9/01/2010 10:15:00 AM
Note: the ISM PMI increased to 56.3 from 55.5 in July (I'll have more later).
Overall construction spending decreased in July.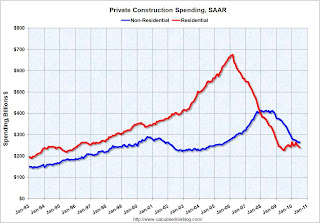 Click on graph for larger image in new window.
This graph shows private residential and nonresidential construction spending since 1993. Note: nominal dollars, not inflation adjusted.
From the Census Bureau: July 2010 Construction at $805.2 Billion Annual Rate
The U.S. Census Bureau of the Department of Commerce announced today that construction spending during July 2010 was estimated at a seasonally adjusted annual rate of $805.2 billion, 1.0 percent (±1.4%)* below the revised June estimate of $813.1 billion. The July figure is 10.7 percent (±1.8%) below the July 2009 estimate of $901.2 billion.Private residential construction spending has turned down again - after the tax credit expired - and residential investment (RI) will be a drag on Q3 GDP. The "good" news is the overall drag from RI will be much smaller than during 2006, 2007 and 2008.
...
Spending on private construction was at a seasonally adjusted annual rate of $506.4 billion, 0.8 percent (±1.3%)* below the revised June estimate of $510.7 billion. Residential construction was at a seasonally adjusted annual rate of $240.3 billion in July, 2.6 percent (±1.3%) below the revised June estimate of $246.7 billion. Nonresidential construction was at a seasonally adjusted annual rate of $266.1 billion in July, 0.8 percent (±1.3%)* above the revised June estimate of $264.0billion.
ADP: Private Employment decreases 10,000 in August
by Calculated Risk on 9/01/2010 08:15:00 AM
ADP reports:
Private sector employment decreased by 10,000 from July to August on a seasonally adjusted basis, according to the latest ADP National Employment Report® released today. The estimated change of employment from June to July was revised down slightly, from the previously reported increase of 42,000 to an increase of 37,000.Note: ADP is private nonfarm employment only (no government jobs).
The decline in private employment in August confirms a pause in the recovery already evident in other economic data.
...
Unlike the estimate of total establishment employment to be released on Friday by the Bureau of Labor Statistics (BLS), today’s figure does not include the effects of federal hiring — and now firing — for the 2010 Census.
The consensus was for ADP to show an increase of about 20,000 private sector jobs in August, so this was below consensus.
The BLS reports on Friday, and the consensus is for a decrease of 90,000 payroll jobs in August, on a seasonally adjusted (SA) basis, with the loss of around 116,000 temporary Census 2010 jobs (+26,000 ex-Census).
MBA: Purchase Application activity suggests low level of existing home sales in August and September
by Calculated Risk on 9/01/2010 07:33:00 AM
The MBA reports: Mortgage Applications Increase as Rates Hit New Low in MBA Weekly Survey
The Refinance Index increased 2.8 percent from the previous week and is at its highest level since May 1, 2009. The seasonally adjusted Purchase Index increased 1.8 percent from one week earlier.
...
"Refinancing activity picked up again last week, reaching new 15-month highs, as borrowers took advantage of even lower mortgage rates. The drop in mortgage rates was in line with Treasury rates as the latest data continue to show weak economic growth and an exceptionally weak housing market," said Michael Fratantoni, MBA's Vice President of Research and Economics. "The sharp decline in MBA's Purchase Application index in May had provided a clear leading indicator of the drops in new and existing home sales that were reported for June and July. Despite the slight increase in purchase activity in the past week, the continued low level of purchase applications indicates we are unlikely to see an increase in new home sales reported for August or existing home sales reported for September."
...
The average contract interest rate for 30-year fixed-rate mortgages decreased to 4.43 percent from 4.55 percent, with points increasing to 1.34 from 0.89 (including the origination fee) for 80 percent loan-to-value (LTV) ratio loans. The contract rate is a new low for this survey.
 Click on graph for larger image in new window.
This graph shows the MBA Purchase Index and four week moving average since 2002.
Usually I start the graph in January 1990, but this shorter term graph shows that the purchase index has been moving sideways since May of this year.
As the MBA's Fratantoni noted, this suggests existing home sales in August and September will be around the same level as in July.
Tuesday, August 31, 2010
Existing Home Inventory declines slightly in August
by Calculated Risk on 8/31/2010 07:10:00 PM
Tom Lawler reports that at the end of August, listings on Realtor.com totaled 4,007,860, down 0.7% from 4,038,133 at the end of July. This is 2.5% above August 2009.
The NAR reported inventory at 3.98 million at the end of July, and at 3.924 million in August 2009. So they will probably report inventory at close to 4 million for August.
Since sales probably only increased slightly in August, the months-of-supply metric will be in double digits again in August and probably still over 12 months.
Note: there is a seasonal pattern for existing home inventory. Usually inventory peaks in July and declines slightly through October - and then declines sharply at the end of the year as sellers take their homes off the market for the holidays.
Restaurant Index shows contraction in July
by Calculated Risk on 8/31/2010 04:14:00 PM
This is one of several industry specific indexes I track each month.  Click on graph for larger image in new window.
Same store sales and customer traffic both declined in July (on a year-over-year basis). This is the fourth consecutive month of declines.
Unfortunately the data for this index only goes back to 2002.
Note: Any reading above 100 shows expansion for this index.
From the National Restaurant Association (NRA): Restaurant Industry Outlook Remained Uncertain in July as Restaurant Performance Index Remains Essentially Flat
As a result of soft sales and traffic levels and a deteriorating outlook among restaurant operators, the National Restaurant Association’s comprehensive index of restaurant activity remained essentially flat in July. The Association’s Restaurant Performance Index (RPI) – a monthly composite index that tracks the health of and outlook for the U.S. restaurant industry – stood at 99.4 in July, down 0.1 percent from June and its fourth consecutive decline. In addition, the RPI stood below 100 for the third consecutive month, which signifies contraction in the index of key industry indicators.Restaurants are a discretionary expense, and this contraction could be because of the sluggish recovery or might suggest further weakness in consumer spending in the months ahead.
...
Restaurant operators reported negative same-store sales for the fourth consecutive month in July, with the overall results similar to the June performance.
...
Restaurant operators also reported a net decline in customer traffic levels in July.
...
Restaurant operators have become less optimistic about their prospects for sales growth in recent months.
emphasis added


