 RSS Feed
 by Calculated Risk on 12/26/2012 08:39:00 AM
Wednesday, December 26, 2012
LPS: House Price Index increased 0.3% in October, Up 4.3% year-over-year
Notes: I follow several house price indexes (Case-Shiller, CoreLogic, LPS, Zillow, FNC and more). The timing of different house prices indexes can be a little confusing. LPS uses October closings only (not a three month average like Case-Shiller or a weighted average like CoreLogic), excludes short sales and REOs, and is not seasonally adjusted.
From LPS: U.S. Home Prices Up 0.3 Percent for the Month; Up 4.3 Percent Year-Over-Year
Lender Processing Services ... today released its latest LPS Home Price Index (HPI) report, based on October 2012 residential real estate transactions. The LPS HPI combines the company’s extensive property and loan-level databases to produce a repeat sales analysis of home prices as of their transaction dates every month for each of more than 15,500 U.S. ZIP codes. The LPS HPI represents the price of non-distressed sales by taking into account price discounts for REO and short sales.The LPS HPI is off 22.6% from the peak in June 2006. Note: The press release has data for the 20 largest states, and 40 MSAs. LPS shows prices off 53.6% from the peak in Las Vegas, 45.5% off from the peak in Riverside-San Bernardino, CA (Inland Empire), and barely off in Austin and Houston.
Looking at the year-over-year price change throughout the year - in May, the LPS HPI was up 0.4% year-over-year, in June the index was up 0.9% year-over-year, 1.8% in July, 2.6% in August, 3.6% in September, and now 4.3% in October. This is steady improvement on a year-over-year basis. Note: Case-Shiller for October will be this morning.
Tuesday, December 25, 2012
Wednesday: Case-Shiller House Prices, Richmond Fed Manufacturing Survey
by Calculated Risk on 12/25/2012 07:33:00 PM
First a great story about Jack Klugman from Joshua Green at the WaPo: Jack Klugman’s secret, lifesaving legacy
And for those seeing Les Mis this week, here are couple of incredible performances of "I Dreamed a Dream", first by Ruthie Henshall at the 10th Anniversary and another by Lea Salonga at the 25th Anniversary Concert.
Wednesday economic releases:
• At 9:00 AM, the S&P/Case-Shiller House Price Index for October will be released. Although this is the October report, it is really a 3 month average of August, September and October. The consensus is for a 4.1% year-over-year increase in the Composite 20 index (NSA) for September. The Zillow forecast is for the Composite 20 to increase 4.1% year-over-year, and for prices to increase 0.3% month-to-month seasonally adjusted.
• At 10:00 AM, the Richmond Fed Survey of Manufacturing Activity for December will be released. The consensus is for a decrease to 6 for this survey from 9 in November (Above zero is expansion).
A couple of posts yesterday:
• Review of My 2012 Forecasts
• Ten Economic Questions for 2013
Two more questions this week for the December economic prediction contest (Note: You can now use Facebook, Twitter, or OpenID to log in).
Private Investment and the Business Cycle
by Calculated Risk on 12/25/2012 01:01:00 PM
A little holiday cheer ...
Discussions of the business cycle frequently focus on consumer spending (PCE: Personal consumption expenditures), but the key is to watch private domestic investment, especially residential investment. Even though private investment usually only accounts for around 15% of GDP, the swings for private investment are significantly larger than for PCE during the business cycle, so private investment has an outsized impact on GDP at transitions in the business cycle.
The first graph shows the real annualized change in GDP and private investment since 1960 (this is a 3 quarter centered average to smooth the graph).
GDP has fairly small annualized changes compared to the huge swings in investment, especially during and just following a recession. This is why investment is one of the keys to the business cycle.
 Click on graph for larger image.
Note that during the recent recession, the largest decline for GDP was in Q4 2008 (a 8.9% annualized rate of decline). On a three quarter center averaged basis (as presented on graph), the largest decline was 5.9% annualized.
However the largest decline for private investment was a 43% annualized rate! On a three quarter average basis (on graph), private investment declined at a 35% annualized rate.
The second graph shows the contribution to GDP from the four categories of private investment: residential investment, equipment and software, nonresidential structures, and "Change in private inventories". Note: this is a 3 quarter centered average of the contribution to GDP.
This is important to follow because residential investment tends to lead the economy, equipment and software is generally coincident, and nonresidential structure investment lags the business cycle. Red is residential, green is equipment and software, and blue is investment in non-residential structures. The usual pattern - both into and out of recessions is - red, green, and blue.
 The dashed purple line is the "Change in private inventories". This category has significant ups and downs, but is always negative during a recession, and provides a boost to GDP just after a recession.
The key leading sector - residential investment - has lagged this recovery because of the huge overhang of existing inventory. Usually residential investment is a strong contributor to GDP growth and employment in the early stages of a recovery, but not this time - and that weakness was a key reason why the recovery was sluggish so far.
Residential investment finally turned positive during 2011 and made a positive contribution to GDP in 2012.
 What does this mean for the business cycle? Usually residential investment would turn down before a recession, and that isn't happening right now. Instead residential investment is starting to increase.
The third graph shows residential investment as a percent of GDP. Residential investment as a percent of GDP is just above the record low, and it seems likely that residential investment as a percent of GDP will increase further in 2013.
The key downside risk for the US economy in 2013 is too much austerity, too quickly. However, barring a policy mistake (I expect a fiscal agreement), it seems unlikely there will be a sharp decline in private investment in 2013. This is because residential investment is already near record lows as a percent of GDP and will probably increase further in 2013, and that suggests the US will avoid a new recession in 2013.
Happy Holidays!
by Calculated Risk on 12/25/2012 09:01:00 AM
Happy Holidays and Merry Christmas to all!
A couple of posts yesterday:
• Review of My 2012 Forecasts
• Ten Economic Questions for 2013
And a repeat gift ... a common question, using excel, is how do you get from this:
Thanks to all. Happy Holidays!
Monday, December 24, 2012
Ten Economic Questions for 2013
by Calculated Risk on 12/24/2012 06:43:00 PM
Here are some questions I'm thinking about ...
1) US Policy: This is probably the biggest downside risk for the US economy in 2013. I assume some sort of fiscal agreement will be reached soon, but how much austerity will be included? What will happen with the Alternative Minimum Tax (AMT)? What about emergency unemployment benefits? What about extending the mortgage relief for debt forgiveness (important for short sales)?
And what about other policy in 2013 such as the "default ceiling" (aka debt ceiling)? In 2011, the threat of a US government default slowed the economy to almost a standstill for a month. Right now the White House is taking the Ronald Reagan approach (when the Democrats pulled a similar reckless stunt) and they are saying President Obama will only sign a clean debt ceiling bill. Good. Hopefully default is off the table, but you never know.
2) Economic growth: Heading into 2013 there are still significant downside risks from the European financial crisis and from U.S. fiscal policy. Will the U.S. economy grow in 2013? Or will there be another recession?
3) Employment: How many payroll jobs will be added in 2013? Will we finally see some pickup over the approximately 2 million private sector job creation rate of 2011 and 2012?
4) Unemployment Rate: The unemployment rate is still elevated at 7.7% in November. For the last two years I've been too pessimistic on the unemployment rate because I was expecting some minor bounce back in the participation rate. Instead the participation rate continued to decline. Maybe 2013 will be the year the participation rate increases a little, or at least stabilizes. Economists at the SF Fed wrote about this last week: Will the Jobless Rate Drop Take a Break?
The recent recession was unusual in its depth and its duration. Labor market conditions have remained difficult for a long time. As a result, large numbers of discouraged workers have stopped looking for jobs. A big unknown is whether these workers will stay out of the labor force permanently or enter as the economy recovers. If these workers join the labor force, increasing participation could have a major impact on the unemployment rate in the coming years.What will the unemployment rate be in December 2013?
5) Inflation: The Fed has made it clear they will tolerate a little more inflation, but currently the inflation rate is running below the Fed's 2% target. Will the inflation rate rise or fall in 2013?
6) Monetary Policy: Currently the Fed is planning to buy $85 billion in Treasury and agency mortgage-backed securities per month as part of the open-ended QE3. Will the Fed continue all year at this pace? Or will the Fed increase their purchase rate? Or will the Fed decrease their purchase rate, stop these purchases, or even sell some securities?
7) House Prices: It now appears house prices, as measured by the national repeat sales indexes, bottomed in early 2012? What will happen with house prices in 2013?
8) Housing Inventory: Over the last few years, we've seen a dramatic plunge in existing home inventory. Will inventory bottom in 2013?
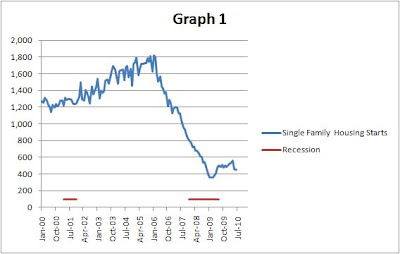
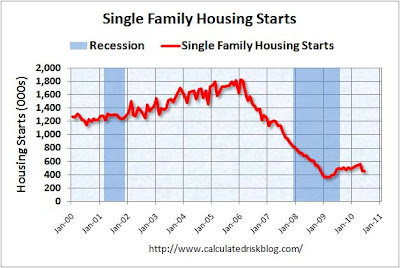
9) Residential Investment: Residential investment (RI) picked up in 2012, with new home sales and housing starts increasing 20% or so. Note: RI is mostly investment in new single family structures, multifamily structures, home improvement and commissions on existing home sales. This still leaves RI at a historical low level. How much will RI increase in 2013?
10) Europe and the Euro: What will happen in Europe in 2013? Will a country leave the euro this coming year, will the euro-zone implode, or will 2013 be the bottom for the euro-zone economies?
I'm sure there are other key questions, but these are the ones I'm thinking about now.


