 RSS Feed
 by Calculated Risk on 12/24/2012 11:52:00 AM
Monday, December 24, 2012
Review of My 2012 Forecasts
Near the end of each year I try to post a few general forecasts for the coming year. The purpose is to try to provide an overview of how I think the economy will perform.
Some years there are BIG calls, like in late 2006 when I predicted a recession would start in 2007 (made it by one month!). Another “BIG” call example was in early 2009 when I started writing about a second half economic recovery.
Most of my forecasts are more mundane, as an example for 2012 GDP, I wrote:
“my guess is growth will be sluggish relative to the slack in the system, but above the 2011 growth rate. “Right now “sluggish” looks correct, and if Q4 2012 GDP is at or above 1.6% (annualized), then 2012 will actually be better than 2011 (Q4 over Q4 of previous year). But even if I had been wrong, I find it useful to write down some forecasts and then to understand why I was right or wrong. (I’d say my guess on growth was about right).
Of course my BIG call for 2012 was that house prices would finally find a bottom as measured by the national repeat sales indexes (see: The Housing Bottom is Here). In early 2012, I wrote:
“My guess is that nominal house prices, using the national repeat sales indexes and not seasonally adjusted, will bottom in March 2012.”As of right now – with prices up almost 5% seasonally adjusted since early this year – the house price bottom call looks correct.
Note: When I wrote that post, the consensus was house prices would decline throughout 2012. Since then the consensus has changed and most analysts now think prices bottomed early this year.
I did get a couple of forecasts wrong in 2012. For the unemployment rate, I wrote:
A couple of predictions.Even though I’ve been arguing that most of the decline in the participation rate over the last few years was due to changing demographics (as opposed to cyclical due to the recession), I still thought we’d see some slight increase in participation in 2012 – and that didn’t happen.
• The participation rate will rise slightly in 2012 and probably end the year in the 64.0% to 64.5% range.
• The unemployment rate will still be in the 8% to 9% range in December 2012.
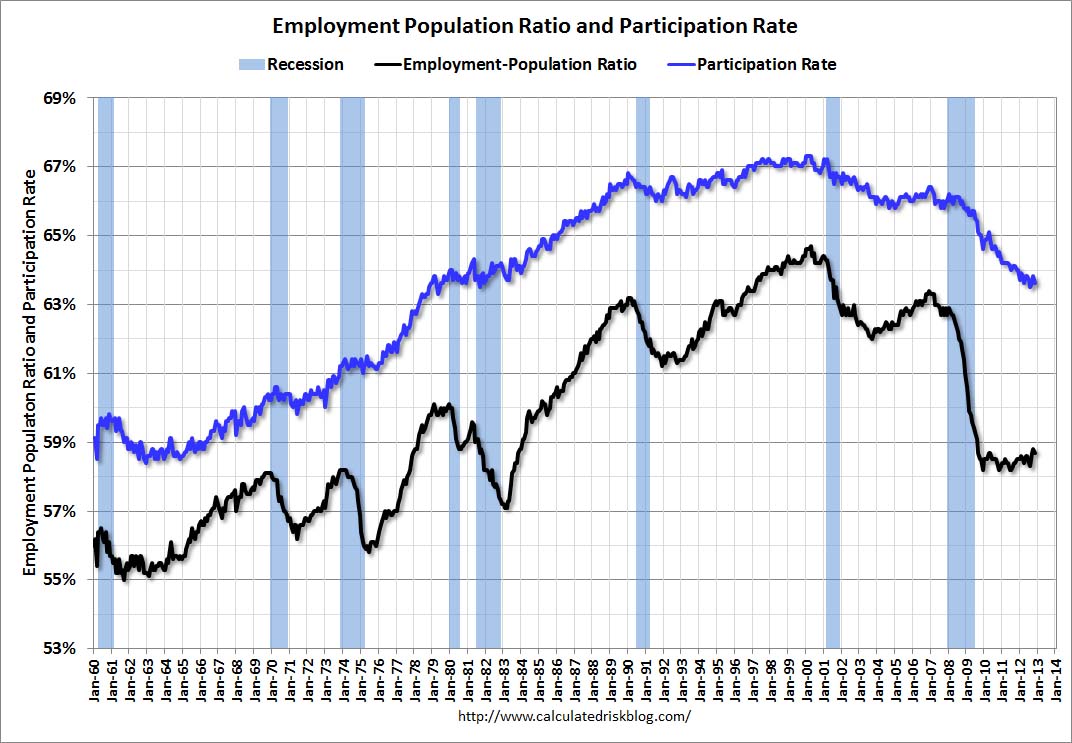 Click on graph for larger image.
The participation rate fell to 63.6% in November, and the unemployment rate declined to 7.7%. (Participation rate is the blue line. This is the percentage of the working age population in the labor force).
Since I was wrong on the participation rate, my forecast for the unemployment rate was too pessimistic.
I was also too pessimistic on foreclosures. I wrote:
Will foreclosure activity increase in 2012?The policy changes were announced, but the lenders focused more on modifications and short sales than foreclosures, and foreclosure activity has only picked up recently in some judicial foreclosure states.
This is a difficult question. There are several significant policy changes in the works: 1) a possible Mortgage Settlement, 2) HARP refinance (the automated program starts in March), and 3) a REO to rental program. It appears the overall goal of these policy changes is to reduce the large backlog of seriously delinquent loans while, at the same time, not flood the housing market with distressed homes.
My guess is the policy changes will all be announced in the next few months, and that foreclosure activity will increase significantly.
On employment I was close. I wrote:
My guess is private employment will increase around 150 to 200 thousand per month on average in 2012; about the same rate as in 2011.That was about right. The economy has added 1.7 million private sector jobs through November (over 1.8 million including the preliminary benchmark revision).
With over 13 million unemployed workers - and 5.6 million unemployed for more than 26 weeks - adding 2 million private sector jobs will not seem like much of job recovery for many Americans. Hopefully I'm too pessimistic.
A key forecast – that appears correct – was that the drag from state and local governments would end around mid-year. I wrote:
It is looking like there will be less drag from state and local governments in 2012, and that most of the drag will be over by the end of Q2 (end of FY 2012). This doesn't mean state and local government will add to GDP in the 2nd half of 2012, just that the drag on GDP and employment will probably end. Just getting rid of the drag will help.
 This graph shows total state and government payroll employment since January 2007. State and local governments lost 129,000 jobs in 2009, 262,000 in 2010, and 230,000 in 2011. So far in 2012, state and local governments have actually added a few jobs, and state and local government employment increased by 4,000 in November.
Note: The dashed line shows an estimate including the benchmark revision.
It appears most of the state and local government layoffs are over, however the Federal government layoffs are ongoing.
 This graph shows the contribution to percent change in GDP for residential investment and state and local governments since 2005.
The blue bars are for residential investment (RI), and RI was a significant drag on GDP for several years. Now RI has added to GDP growth for the last 6 quarters (through Q3 2012).
The red bars are for state and local governments. Although not as large a negative as the worst of the housing bust (and much smaller spillover effects), this decline has been relentless and unprecedented. The good news is the drag appears to be ending, and state and local governments actually added to GDP growth in Q3 2012 - for the first time since Q3 2009.
A few more forecasts - On monetary policy I wrote:
• I expect the Fed will change their communication strategy and add a likely future path of the Fed Funds rate to the quarterly economic forecasts.The Fed introduced the new communication strategy, and then changed it again near the end of 2012. They waited a little longer than I expected, and the FOMC announced QE3 in September.
• I think QE3 is likely, but more towards mid-year - and [timing] is data dependent.
And on inflation:
The bottom line is the inflation rate will probably stay low in 2012 with high unemployment and low resource utilization. I expect QE3 to be announced before mid-year, and that will probably keep the inflation rate near the Fed's target (as opposed to falling further). But I don't see inflation as a significant threat in 2012.The inflation outlook was correct. It is stunning how many analysts and policymakers have consistently been wrong on inflation for the last several years - and they still haven't changed their views or models!
And on Europe and the Euro:
So once again my guess is the euro will survive another year without losing any countries (Assuming a Greek debt deal). There will be plenty of blowups along the way, but I think the impact on the US economy will be fairly minimal.I was pessimistic on Europe, but less pessimistic than many others. And once again Europe made it through another year.
All and all the economy evolved about as I expected in 2012. I’ll try to post some forecasts for 2013 soon, but I’ll wait until we see the details of the fiscal agreement. Policy matters – and the key downside risk for the US economy in 2013 is rapid austerity.
"Fiscal Cliff": Weary eyes turn toward the Senate
by Calculated Risk on 12/24/2012 09:23:00 AM
From the NY Times: Search for Way Through Fiscal Impasse Turns to the Senate
Senators Kay Bailey Hutchison of Texas and Johnny Isakson of Georgia, both Republicans, implored Senate leaders to reach an accommodation with Mr. Obama when Congress returns on Thursday, even if that meant that taxes would go up for those with high incomes and that spending cuts would be put off.I think Isakson is correct about what will happen in January - that Congress will approve an agreement after the tax cuts expire so they can claim they are cutting taxes. Politics is weird.
“The president’s statement is right,” Mr. Isakson said Sunday on the ABC program “This Week.” “No one wants taxes to go up on the middle class."...
“The truth of the matter is, if we do fall off the cliff after the president is inaugurated, he’ll come back, propose just what he proposed yesterday in leaving Washington, and we’ll end up adopting it,” Mr. Isakson continued. “But why should we put the markets in such turmoil and the people in such misunderstanding or lack of confidence? Why not go ahead and act now?”
Sunday, December 23, 2012
Sunday Night Futures
by Calculated Risk on 12/23/2012 09:34:00 PM
Happy Holidays to all. There are no releases scheduled for Monday, and the U.S. markets will close early.
We will also get a two day break from the "fiscal cliff"!
Weekend:
• Summary for Week Ending Dec 21st
• Schedule for Week of Dec 23rd
The Asian markets are mostly green tonight, with both the Shanghai Composite and the Hang Seng up slightly.
From CNBC: Pre-Market Data and Bloomberg futures: the S&P futures are down 4 and DOW futures are down 30.
Oil prices have moved up a little recently withWTI futures at $88.46 per barrel and Brent at $108.80 per barrel. Gasoline prices are now near the low for the year.
Gasoline Prices near Low for Year, Expected to Increase
by Calculated Risk on 12/23/2012 05:39:00 PM
Another update on gasoline prices. It looks like prices will finish the year near the low, but probably increase soon.
From CNN: Gas prices slide, but the decline won't last, survey says
The average cost of a gallon of regular gasoline is $3.26, down 58 cents over the past 11 weeks, the Lundberg Survey found.Yesterday:
But that good news at the pump is unlikely to continue, says publisher Tribly Lundberg.
“Higher crude oil prices are translating into higher wholesale gasoline prices,” and retailers will need to pass them through, she says. Expect prices to jump 5 or 10 cents per gallon soon.
• Summary for Week Ending Dec 21st
• Schedule for Week of Dec 23rd
Here is a graph from Gasbuddy.com showing the roller coaster ride for gasoline prices. If you click on "show crude oil prices", the graph displays oil prices for WTI, not Brent; gasoline prices in most of the U.S. are impacted more by Brent prices.
| Orange County Historical Gas Price Charts Provided by GasBuddy.com |
DOT: Vehicle Miles Driven increased 0.3% in October
by Calculated Risk on 12/23/2012 01:39:00 PM
The Department of Transportation (DOT) reported Friday:
Travel on all roads and streets changed by +0.3% (0.9 billion vehicle miles) for October 2012 as compared with October 2011. Travel for the month is estimated to be 251.5 billion vehicle miles.Vehicle miles driven decreased in the Northeast (probably impacted by Hurricane Sandy) and increased in all other regions. The following graph shows the rolling 12 month total vehicle miles driven.
Cumulative Travel for 2012 changed by +0.6% (14.9 billion vehicle miles). The Cumulative estimate for the year is 2,464.5 billion vehicle miles of travel.
The rolling 12 month total is still moving sideways.
 Click on graph for larger image.
In the early '80s, miles driven (rolling 12 months) stayed below the previous peak for 39 months.
Currently miles driven has been below the previous peak for 59 months - and still counting.
The second graph shows the year-over-year change from the same month in the previous year.
 Gasoline prices were up in October compared to October 2011. In October 2012, gasoline averaged of $3.81 per gallon according to the EIA. Last year, prices in October averaged $3.51 per gallon.
 However, as I've mentioned before, gasoline prices are just part of the story. The lack of growth in miles driven over the last 5 years is probably also due to the lingering effects of the great recession (high unemployment rate and lack of wage growth), the aging of the overall population (over 55 drivers drive fewer miles) and changing driving habits of young drivers.
With all these factors, it may be years before we see a new peak in miles driven.


