 RSS Feed
 by Calculated Risk on 4/29/2011 03:04:00 PM
Friday, April 29, 2011
Q1 2011 Details: Investment in Office, Mall, and Lodging, Residential Components
The BEA released the underlying detail data today for the Q1 Advance GDP report. Here is a look at office, mall and lodging investment:
 Click on graph for larger image in new graph gallery.
This graph shows investment in offices, malls and lodging as a percent of GDP. Office investment as a percent of GDP peaked at 0.46% in Q1 2008 and has declined sharply to a new series low as a percent of GDP (data series starts in 1959).
Investment in multimerchandise shopping structures (malls) peaked in 2007 and has fallen by 70% (note that investment includes remodels, so this will not fall to zero). Mall investment is also at a series low (as a percent of GDP).
The bubble boom in lodging investment was stunning. Lodging investment peaked at 0.32% of GDP in Q2 2008 and has fallen by 80% already.
Notice that investment for all three categories typically falls for a year or two after the end of a recession, and then usually recovers very slowly (flat as a percent of GDP for 2 or 3 years). Something similar will probably happen again, and there will not be a recovery in these categories until the vacancy rates fall significantly.
The second graph is for Residential investment (RI) components. According to the Bureau of Economic Analysis, RI includes new single family structures, multifamily structures, home improvement, broker's commissions, and a few minor categories (dormitories, manufactured homes).
 This graph shows the various components of RI as a percent of GDP for the last 50 years. Usually the most important components are investment in single family structures followed by home improvement.
Investment in single family structures was just above the record low set in Q2 2009.
Investment in home improvement was at a $151.0 billion Seasonally Adjusted Annual Rate (SAAR) in Q1 (about 1.0% of GDP), significantly above the level of investment in single family structures of $106.3 billion (SAAR) (or 0.7% of GDP).
Brokers' commissions declined slightly in Q1, and are near the lowest level (as a percent of GDP) since the early '80s. In nominal dollar terms, brokers' commissions are back to the 1999 level.
And investment in multifamily structures has been bouncing along at a series low for the last few quarters, although this is expected to increase this year as starts increase.
These graphs show there is currently very little investment in offices, malls and lodging - and also very little investment in most components of residential investment. I expect investment in commercial real estate to bottom mid-year, but the recovery will not start until the vacancy rates fall. For Residential Investment, I expect RI to make a positive contribution to GDP this year for the first time since 2005 - mostly because of increases in multifamily investment and home improvement.
Restaurant Performance Index increases in March
by Calculated Risk on 4/29/2011 11:56:00 AM
This is one of several industry specific indexes I track each month.
 Click on graph for larger image in graph gallery.
The index increased to 101.0 in March (above 100 indicates expansion).
Unfortunately the data for this index only goes back to 2002.
From the National Restaurant Association: Restaurant Industry Outlook Gained Strength in March as Same-Store Sales, Customer Traffic Levels Continued to Improve
The National Restaurant Association’s Restaurant Performance Index (RPI) – a monthly composite index that tracks the health of and outlook for the U.S. restaurant industry – stood at 101.0 in March, up 0.3 percent from February and the third gain in the last four months. In addition, March represented the sixth time in the last seven months that the RPI stood above 100, which signifies expansion in the index of key industry indicators.Increased traffic and sales, and a positive outlook for capital spending and hiring ... another solid report.
“The March increase in the Restaurant Performance Index was fueled by continued improvements in the same-store sales and customer traffic indicators,” said Hudson Riehle, senior vice president of the Research and Knowledge Group for the Association. “Most notably, the overall Current Situation component of the RPI stood above 100 for the first time in 43 months, which signifies expansion in the indicators of current industry performance.”
...
Restaurant operators continued to report improvements in same-store sales in March. ... Restaurant operators also reported a net increase in customer traffic levels in March.
...
Along with an optimistic sales outlook, restaurant operators’ plans for capital spending rose to its highest level in 41 months.
...
For the sixth consecutive month, restaurant operators reported a positive outlook for staffing gains in the months ahead.
Earlier:
• Consumer Sentiment increases slightly in April compared to March
• Personal Income and Outlays Report for March
Consumer Sentiment increases slightly in April compared to March
by Calculated Risk on 4/29/2011 09:55:00 AM
• From the Chicago Business Barometer™ Tempered: "The Chicago Purchasing Managers reported the CHICAGO BUSINESS BAROMETER slackened but remained strong, indicating expanding economic activity for the nineteenth consecutive month. In response to special questions about the Japanese disaster, panelists reported minimal impact."
The overall index decreased to 67.6 from 70.6 in March. This was below consensus expectations of 69.2. Note: any number above 50 shows expansion. The employment index decreased to a still strong 63.7 from 65.6. This was another fairly strong report.
• The final April Reuters / University of Michigan consumer sentiment index decreased to 68.9 in April from the preliminary 69.6. This was up slightly from the March reading of 67.5.
 Click on graph for larger image in graphic gallery.
This was below the consensus forecast of 70.0.
In general consumer sentiment is a coincident indicator and is usually impacted by employment (and the unemployment rate) and gasoline prices.
This low reading is probably due to $4 per gallon gasoline prices.
Personal Income and Outlays Report for March
by Calculated Risk on 4/29/2011 08:30:00 AM
The BEA released the Personal Income and Outlays report for March:
Personal income increased $67.0 billion, or 0.5 percent ... Personal consumption expenditures (PCE) increased $60.7 billion, or 0.6 percent.Real PCE was revised up significantly for both January and February.
...
Real PCE -- PCE adjusted to remove price changes -- increased 0.2 percent in March, compared with an increase of 0.5 percent in February.
The following graph shows real Personal Consumption Expenditures (PCE) through March (2005 dollars). Note that the y-axis doesn't start at zero to better show the change.
 Click on graph for larger image in graph gallery.
PCE increased 0.5% in March, but real PCE only increased 0.2% as the price index for PCE increased 0.4 percent in March.
Note: Core PCE - PCE excluding food and energy - increased 0.1% in March.
 The second graph shows real personal income less transfer payments as a percent of the previous peak. This has been slow to recover - and real personal income less transfer payments declined slightly in March. This remains 3.1% below the previous peak.
The personal saving rate was unchanged at 5.5% in March.
Personal saving -- DPI less personal outlays -- was $651.2 billion in March, compared with $647.5 billion in February. Personal saving as a percentage of disposable personal income was 5.5 percent in March, the same as in February.
 This graph shows the saving rate starting in 1959 (using a three month trailing average for smoothing) through the March Personal Income report.
 One of the surprises in the Q1 GDP report was the 2.7% annualized growth rate for PCE. PCE growth in January and February was revised up significantly, and PCE in March increased at a 3.1% annualized rate (over the last 3 months).
Thursday, April 28, 2011
European Bond and CDS Spreads
by Calculated Risk on 4/28/2011 09:22:00 PM
Here is a look at European bond spreads from the Atlanta Fed weekly Financial Highlights released today (graph as of April 27th):
 Click on graph for larger image in new window.
From the Atlanta Fed:
Since the March FOMC meeting, peripheral European bond spreads (over German bonds) continue to be elevated, with those of Greece, Ireland, and Portugal setting record highs.The second graph shows the Credit Default Swap (CDS) spreads:
Since the March FOMC meeting, the 10-year Greece-to-German bond spread has widened by 189 basis points (bps), through April 26. The spreads for Ireland and Portugal have soared higher by 85 and 237 bps, respectively, over the same period.
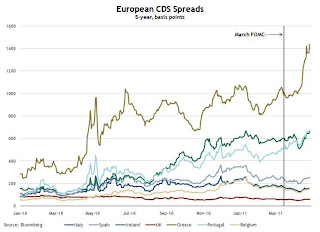 From the Atlanta Fed:
 The CDS spread on Greek debt has widened about 430 basis points (bps) since the March FOMC meeting, while those on Portuguese and Irish debt continue to be high.Here is a story from Reuters discussing the Greece CDS (and possible haircuts of 60%): Upward bias seen for Greek bond yields, trade choppy
The yield on Greece ten year bonds decreased to 15.7% today and the two year yield was down slightly to 24.9%.
Here are the ten year yields for Ireland at 10.4%, Portugal up to a record 9.7%, and Spain at 5.4%.
Earlier:
• Advance Report: Real Annualized GDP Grew at 1.8% in Q1
• Residential Investment and Non-Residential investment in Structures at Record Lows as Percent of GDP


