 RSS Feed
 by Calculated Risk on 10/31/2010 01:14:00 PM
Sunday, October 31, 2010
Schedule for Week of Oct 31st
The previous post is the Summary for Week ending Oct 30th.
The highly anticipated second round of Federal Reserve quantitative easing (QE2) will be announced on Wednesday at 2:15 PM (when the FOMC statement is released). The key economic release this week is the October employment report on Friday.
8:30 AM: Personal Income and Outlays for September. The consensus is for a 0.3% increase in personal income and a 0.4% increase in personal spending, and for the Core PCE price index to increase 0.1%.
10:00 AM: ISM Manufacturing Index for October. The consensus is for 54.5 or about the same as the 54.4 in September.
10:00 AM: Construction Spending for September. The consensus is for a 0.5% decline in construction spending.
10:00 AM: Q3 Housing Vacancies and Homeownership from the Census Bureau. In Q2 2010, this report indicated that the homeownership rate fell to the lowest level since 1999 (66.9% in Q2 2010). The homeowner and rental vacancy rates provide a hint at the number of excess housing units (Note: this data is based on limited surveys and an estimate of the housing inventory).
Expected: October Personal Bankruptcy Filings
7:00 AM: The Mortgage Bankers Association (MBA) will release the mortgage purchase applications index.
8:15 AM: The ADP Employment Report for October. This report is for private payrolls only (no government). The consensus is for +20,000 payroll jobs in October - still weak, but an improvement over the 39,000 jobs reported lost in September.
All day: Light vehicle sales for October. Light vehicle sales are expected to increase in October to around 12.0 million (Seasonally Adjusted Annual Rate), from 11.76 million in September. If correct, this will be highest sales rate in 2 years (excluding Cash-for-clunkers in August 2009).
10:00 AM: Manufacturers' Shipments, Inventories and Orders for September. The consensus is for a 1.8% increase in orders. Also important will be the growth in inventories, and the inventory-to-sales ratio.
10:00 AM: ISM non-Manufacturing Index for October. The consensus is for an increase to 54.0 from 53.2 in September.
2:15 PM: FOMC statement released. The key will be how the FOMC will implement the 2nd round of quantitative easing.
8:30 AM: The initial weekly unemployment claims report will be released. Consensus is for about an increase to 445,000 from 434,000 last week.
8:30 AM: Productivity and Costs for Q3 (Preliminary). The consensus is for a 0.2% increase in unit labor costs.
8:30 AM: Employment Report for October. The consensus is an increase of 60,000 payroll jobs in October, and for the unemployment rate to stay steady at 9.6%.
10:00 AM: Pending Home Sales Index for September. The consensus is for a 3% increase in contracts signed. It usually takes 45 to 60 days to close, so this will provide an early indication of closings in November.
3:00 PM: Consumer Credit for September. The consensus is for another $3 billion decline in consumer credit.
After 4:00 PM: The FDIC will probably have another busy Friday afternoon ...
Note: The Atlanta Fed will host a conference at Jekyll Island, Georgia on November 5th and 6th: The Origins, History, and Future of the Federal Reserve. On Saturday there will be a discussion of "the overvaluation of assets such as land" and the "appropriate policy responses". Also Fed Chairman Ben Bernanke and previous Fed Chairman Alan Greenspan are scheduled to participate on a panel "on the purpose, structure, and functions of the Federal Reserve System".
Summary for Week ending Oct 30th
by Calculated Risk on 10/31/2010 08:30:00 AM
A summary of last week - mostly in graphs. The key reports last week were the Q3 Advance GDP report, and several housing reports (New home sales, existing home sales, and house prices).
The the National Association of Realtors:
 Click on graph for larger image in new window.
This graph shows existing home sales, on a Seasonally Adjusted Annual Rate (SAAR) basis since 1993.
Sales in September 2010 (4.53 million SAAR) were 10% higher than last month, and were 19.1% lower than September 2009 (5.6 million SAAR).
The next graph shows the year-over-year (YoY) change in reported existing home inventory and months-of-supply. Inventory is not seasonally adjusted, so it really helps to look at the YoY change.
 Although inventory decreased slightly from August 2010 to September 2010, inventory increased 8.9% YoY in September. This is the largest YoY increase in inventory since early 2008.
The year-over-year increase in inventory is very bad news because the reported inventory is already historically very high (around 4 million), and the 10.7 months of supply in September is far above normal.
The bottom line: Sales were weak in September - almost exactly at the levels I expected - and will continue to be weak for some time. Inventory is very high - and the significant year-over-year increase in inventory is very concerning. The high level of inventory and months-of-supply will put downward pressure on house prices.
 The Census Bureau reported New Home Sales in September were at a seasonally adjusted annual rate (SAAR) of 307 thousand. This is slightly higher than in August (288 thousand SAAR).
This graph shows New Home Sales vs. recessions for the last 47 years. The dashed line is the current sales rate.
And another long term graph - this one for New Home Months of Supply.
 Months of supply decreased to 8.0 in September from 8.6 in August. The all time record was 12.4 months of supply in January 2009. This is still high (less than 6 months supply is normal).
The 307 thousand annual sales rate for September is just above the all time record low in May (282 thousand). This was the weakest September on record.
New home sales are important for the economy and jobs - and this indicated that residential investment would be a sharp drag on GDP in Q3 (subtracted 0.8 percentage points in Q3).
S&P/Case-Shiller released the monthly Home Price Indices for August (actually a 3 month average of June, July and August).
This includes prices for 20 individual cities, and two composite indices (10 cities and 20 cities).
 This graph shows the nominal seasonally adjusted Composite 10 and Composite 20 indices (the Composite 20 was started in January 2000).
The Composite 10 index is off 29.2% from the peak, and down 0.2% in August(SA).
The Composite 20 index is off 28.8% from the peak, and down 0.3% in August (SA).
The next graph shows the price declines from the peak for each city included in S&P/Case-Shiller indices.
 Prices increased (SA) in only 1 of the 20 Case-Shiller cities in August seasonally adjusted. Only New York saw a price increase (SA) in August, and that was very small.
 Prices in Las Vegas are off 57.5% from the peak, and prices in Dallas only off 6.9% from the peak.
Prices are now falling - and falling just about everywhere. And it appears there are more price declines coming (based on inventory levels and anecdotal reports).
The CoreLogic HPI is a three month weighted average of June, July and August, and is not seasonally adjusted (NSA).
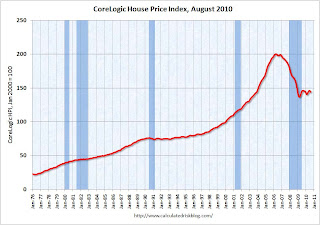 This graph shows the national CoreLogic HPI data since 1976. January 2000 = 100.
The index is down 1.5% over the last year, and off 28.2% from the peak.
The index is 5.4% above the low set in March 2009, and I expect to see a new post-bubble low for this index later this year or early in 2011. Prices are falling in most areas now (unusually for the summer months).
From the BEA:
Real gross domestic product -- the output of goods and services produced by labor and property located in the United States -- increased at an annual rate of 2.0 percent in the third quarter of 2010, (that is, from the second quarter to the third quarter), according to the "advance" estimate released by the Bureau of Economic Analysis.
 This graph shows the quarterly GDP growth (at an annual rate) for the last 30 years. The dashed line is the median growth rate of 3.05%. The current recovery is very weak as the 2nd half slowdown continues.
A key number:
Without the boost in inventories, GDP would have been barely positive in Q3.
Overall this was a weak report and will not derail QE2 next wednesday (further easing from the Fed).
The following graph compares the regional Fed surveys with the ISM manufacturing survey, including the Kansas City survey released this morning:
 For this graph I averaged the New York and Philly Fed surveys (dashed green, through October), and averaged five Fed surveys (blue) including New York, Philly, Richmond, Dallas and Kansas City.
 The Institute for Supply Management (ISM) PMI (red) is through September (right axis).
Although the internals were mixed in the regional Fed surveys, this graph suggests the ISM index will still show expansion in October. The ISM Manufacturing index will be released on Monday November 1st.
Best wishes to all.
Saturday, October 30, 2010
Unofficial Problem Bank list increases to 894 Institutions
by Calculated Risk on 10/30/2010 08:37:00 PM
Note: this is an unofficial list of Problem Banks compiled only from public sources.
Here is the unofficial problem bank list for Oct 29, 2010.
Changes and comments from surferdude808:
As anticipated, the FDIC released its enforcement actions for September this week contributing to many changes to the Unofficial Problem Bank List. This week there were 26 additions and three removals, which results in the list having 894 institutions with $410.7 billion of assets, up from 871 institutions and $402.1 billion of assets last week.
The three removals are for action termination and include First Carolina State Bank, Rocky Mount, NC ($113 million); State Bank of Burnettsville, Burnettsville, IL ($39 million); and The Citizens Bank of Weir, Weir, KS ($6 million).
Among the additions are CNLBank, Orlando, FL ($1.5 billion); Colorado Capital Bank, Castle Rock, CO ($870 million); Malvern Federal Savings Bank, Paoli, PA ($691 million); The Delaware County Bank and Trust Company, Lewis Center, OH ($644 million Ticker: DCBF); County Bank, Rehoboth, DE ($400 million Ticker: CBFD); Bank of Alameda, Alameda, CA ($245 million Ticker: NCLC); Old Harbor Bank, Clearwater, FL ($232 million Ticker: OHBK); and Charter Oak Bank, Napa, CA ($139 million Ticker: CHOB). The FDIC also issued a Prompt Corrective Action order against Charter Oak Bank.
Other changes include Prompt Corrective Actions orders against four institutions already on the list including Firstier Bank, Louisville, KY ($809 million); Nevada Commerce Bank, Las Vegas, NV ($194 million); Valley Community Bank, St. Charles, IL ($142 million); and First Vietnamese American Bank, Westminster, CA ($52 million). Strangely, the FDIC just published the action against Firstier Bank although it is dated April 21, 2010.
Residential Investment declines to new low as Percent of GDP
by Calculated Risk on 10/30/2010 04:45:00 PM
A couple more graphs ...
 Click on graph for larger image in new window.
I'll break down Residential Investment (RI) into components after the GDP details are released this coming week. Note: Residential investment (RI) includes new single family structures, multifamily structures, home improvement, broker's commissions, and a few minor categories.
It is interesting to note that RI as a percent of GDP has declined to a post war low of 2.22%. Some people have asked how could a sector that only accounts for 2.2% of GDP be so important? The answer is that usually RI accounts for a large percentage of the employment and GDP growth in the first year or so of a recovery. Not this time.
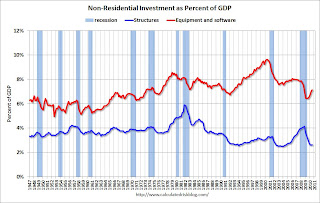 The second graph shows non-residential investment in structures and equipment and software.
Equipment and software investment has been booming, and non-residential investment in structures is near a record low.
Investment Contribution to GDP: Leading and Lagging Sectors
by Calculated Risk on 10/30/2010 12:30:00 PM
By request, the following graph is an update to: The Investment Slump in Q2 2009
The following graph shows the rolling 4 quarter contribution to GDP from residential investment, equipment and software, and nonresidential structures. This is important to follow because residential investment tends to lead the economy, equipment and software is generally coincident, and nonresidential structure investment trails the economy.
For the following graph, red is residential, green is equipment and software, and blue is investment in non-residential structures. The usual pattern - both into and out of recessions is - red, green, blue.
 Click on graph for larger image in new window.
Residential Investment (RI) made a negative contribution to GDP in Q3 2010, and the four quarter rolling average is negative again.
RI was negatively impacted by the slowdown in new home construction, and also because the number of existing home sold fell sharply (real estate commissions are included in RI).
Equipment and software investment has made a significant positive contribution to GDP for five straight quarters (it is coincident).
The contribution from nonresidential investment in structures was slightly positive in Q3. The details will be released next week, but I expect that oil and gas investment made a positive contribution, and hotels, malls and office investment were negative again. As usual nonresidential investment in structures is the last sector to recover.
The key leading sector - residential investment - has lagged this recovery because of the huge overhang of existing inventory. Usually RI is a strong contributor to GDP growth and employment in the early stages of a recovery, but not this time - and this is a key reason why the recovery has been sluggish so far.


