 RSS Feed
 by Calculated Risk on 10/25/2010 08:16:00 PM
Monday, October 25, 2010
WSJ Survey: Housing Inventories up in 19 of 28 Markets Year-over-Year
From Nick Timiraos at the WSJ: Housing Gloom Deepens
The growing pessimism is attributed partly to rising inventory in many markets ... The Wall Street Journal's latest quarterly survey ... in 28 major metropolitan areas found inventories of unsold homes were up in 19 markets ... compared with a year ago ...I highlighted the 8.9% year-over-year inventory increase in the NAR report - a strong indicator of more house price declines to come, especially with the already high level of supply.
"We'll see some additional price declines," said David Berson, chief economist at PMI Group Inc ... "The gains we've seen can't be sustained given the current supply situation."
This survey from the WSJ shows that the inventory increases are fairly widespread. And that suggests that price declines will probably be widespread too. This morning CoreLogic noted that house prices declined in 78 out of the largest 100 metropolitan areas in their August report.
Tomorrow Case-Shiller will report on August house prices, and the expectations are for a slight decline in prices - and it will be interesting to see how many of the 20 Case-Shiller cities are showing price declines.
Misc: Expectations, Dallas Fed Manufacturing, HAMP and Foreclosure-Gate
by Calculated Risk on 10/25/2010 03:57:00 PM
Earlier posts on Existing Home sales:
Texas factory activity increased in October, according to business executives responding to the Texas Manufacturing Outlook Survey. The production index, a key measure of state manufacturing conditions, was positive for the second consecutive month and slightly higher than its September reading.So the headline number improved slightly, but the internals were weak.
Despite the rise in output, several other manufacturing activity indicators fell again. The new orders and shipments indexes were negative for the fifth consecutive month. The capacity utilization index dipped below zero, with more than one-quarter of respondents reporting a decrease.
...
Labor market indicators worsened slightly in October. Hours worked fell for the fourth consecutive month, and the employment index dipped back into negative territory ...
This means that for the median borrower, about 80% of the borrower's income went to servicing debt. And the median is 63.3% after the modification. So I expect the redefault rate to be high. Although Treasury is arguing the modifications are performing "well":
At nine months, nearly 90% of homeowners remain in a permanent modification, with 11% defaulted. Fewer than 16% of permanent modifications are 60+ days delinquent.With a median back end DTI after modification of 63.3%, I expect the redefault rate will move higher. Also here the October Housing Scorecard.
Before I address the specific topics of this conference, I would like to note that we have been concerned about reported irregularities in foreclosure practices at a number of large financial institutions. The federal banking agencies are working together to complete an in-depth review of practices at the largest mortgage servicing operations. We are looking intensively at the firms' policies, procedures, and internal controls related to foreclosures and seeking to determine whether systematic weaknesses are leading to improper foreclosures. We take violations of proper procedures seriously. We anticipate preliminary results of the review next month. In addition, Federal Reserve staff members and their counterparts at other federal agencies are evaluating the potential effects of these problems on the real estate market and financial institutions.
Bank of America... confirmed that it had discovered errors, including incorrect data and misspelled names, in the paperwork it has reviewed.
CoreLogic: House Prices Declined 1.2% in August
by Calculated Risk on 10/25/2010 01:41:00 PM
Notes: CoreLogic reports the year-over-year change. The headline for this post is for the change from July 2010 to August 2010. The CoreLogic HPI is a three month weighted average of June, July and August, and is not seasonally adjusted (NSA).
From CoreLogic: August Home Prices Declined 1.5 Percent Year Over Year
CoreLogic ... today released its Home Price Index (HPI) which shows that home prices in the U.S. declined for the first time this year. According to the CoreLogic HPI, national home prices, including distressed sales, declined 1.5 percent in August 2010 compared to August 2009 and increased by 0.6 percent in July 2010 compared to July 2009. Excluding distressed sales, year-over-year prices declined 0.4 percent in August 2010. ...
“Price declines are geographically expanding as 78 out of the largest 100 metropolitan areas are experiencing declines, up from 58 just one month ago” said Mark Fleming, chief economist for CoreLogic.
 Click on graph for larger image in new window.
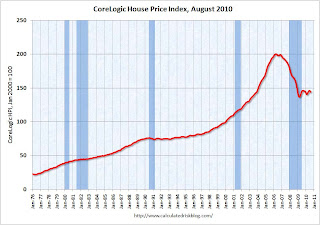
 This graph shows the national CoreLogic HPI data since 1976. January 2000 = 100.
The index is down 1.5% over the last year, and off 28.2% from the peak.
The index is 5.4% above the low set in March 2009, and I expect to see a new post-bubble low for this index later this year or early in 2011. As Fleming noted, prices are falling in most areas now (unusually for the summer months).
Earlier posts on Existing Home sales:
Existing Home Inventory increases 8.9% Year-over-Year
by Calculated Risk on 10/25/2010 11:22:00 AM
Earlier the NAR released the existing home sales data for September; here are a couple more graphs ...
The first graph shows the year-over-year (YoY) change in reported existing home inventory and months-of-supply. Inventory is not seasonally adjusted, so it really helps to look at the YoY change.
 Click on graph for larger image in new window.
Although inventory decreased slightly from August 2010 to September 2010, inventory increased 8.9% YoY in September. This is the largest YoY increase in inventory since early 2008.
Note: Usually July is the peak month for inventory.
The year-over-year increase in inventory is very bad news because the reported inventory is already historically very high (around 4 million), and the 10.7 months of supply in September is far above normal.
And double digit months-of-supply suggests house prices will continue to fall.
 By request - the second graph shows existing home sales Not Seasonally Adjusted (NSA).
The red columns are for 2010. Sales for the last three months are significantly below the previous years, and sales will probably be well weak for the remainder of 2010.
The bottom line: Sales were weak in September - almost exactly at the levels I expected - and will continue to be weak for some time. Inventory is very high - and the significant year-over-year increase in inventory is very concerning. The high level of inventory and months-of-supply will put downward pressure on house prices.
September Existing Home Sales: 4.53 million SAAR, 10.7 months of supply
by Calculated Risk on 10/25/2010 10:00:00 AM
The NAR reports: September Existing-Home Sales Show Another Strong Gain
Existing-home sales, which are completed transactions that include single-family, townhomes, condominiums and co-ops, jumped 10.0 percent to a seasonally adjusted annual rate of 4.53 million in September from a downwardly revised 4.12 million in August, but remain 19.1 percent below the 5.60 million-unit pace in September 2009 when first-time buyers were ramping up in advance of the initial deadline for the tax credit last November.
...
Total housing inventory at the end of September fell 1.9 percent to 4.04 million existing homes available for sale, which represents a 10.7-month supply at the current sales pace, down from a 12.0-month supply in August.
 Click on graph for larger image in new window.
This graph shows existing home sales, on a Seasonally Adjusted Annual Rate (SAAR) basis since 1993.
Sales in September 2010 (4.53 million SAAR) were 10% higher than last month, and were 19.1% lower than September 2009 (5.6 million SAAR).
 The second graph shows nationwide inventory for existing homes.
According to the NAR, inventory decreased slightly to 4.04 million in September from August from 4.12 million in August. The all time record high was 4.58 million homes for sale in July 2008.
Inventory is not seasonally adjusted and there is a clear seasonal pattern with inventory increasing in the spring and into the summer. I'll have more on inventory later ...
 The last graph shows the 'months of supply' metric.
Months of supply decreased to 10.7 months in September from 12.0 months in August. This is extremely high and suggests prices, as measured by the repeat sales indexes like Case-Shiller and CoreLogic, will continue to decline.
Ignore the NAR spin and the median price! These fairly weak numbers are exactly what I expected.
The ongoing high level of supply - and double digit months-of-supply are the key stories. I'll have more ...


