 RSS Feed
 by Calculated Risk on 9/23/2010 11:28:00 AM
Thursday, September 23, 2010
Existing Home Inventory increases 1.5% Year-over-Year
Earlier the NAR released the existing home sales data for August; here are a couple more graphs ...
The first graph shows the year-over-year (YoY) change in reported existing home inventory and months-of-supply. Inventory is not seasonally adjusted, so it really helps to look at the YoY change.  Click on graph for larger image in new window.
Although inventory decreased slightly from July 2010 to August 2010, inventory increased 1.5% YoY in August.
Note: Usually July is the peak month for inventory.
The year-over-year increase in inventory is especially bad news because the reported inventory is already historically very high (around 4 million), and the 11.6 months of supply in August is far above normal.
Based on the MBA mortgage purchase applications index, it appears there will be little increase in sales over the next couple of months (sales will probably remain in the low-to-mid 4 million SAAR range). That means we will see double digit months-of-supply for some time - and that suggests house prices will continue to fall.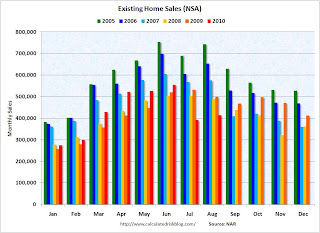 By request - the second graph shows existing home sales Not Seasonally Adjusted (NSA).
The red columns are for 2010. Sales for the last two months are significantly below the previous years, and sales will probably be well below the previous years for the remainder of 2010.
The bottom line: Sales were very weak in August - almost exactly at the levels I expected - and will continue to be weak for some time. Inventory is very high, and that will put downward pressure on house prices.
Existing Home Sales at 4.1 million SAAR, 11.6 months of supply
by Calculated Risk on 9/23/2010 10:00:00 AM
The NAR reports: Existing-Home Sales Move Up in August
Existing-home sales, which are completed transactions that include single-family, townhomes, condominiums and co-ops, increased 7.6 percent to a seasonally adjusted annual rate of 4.13 million in August from an upwardly revised 3.84 million in July, but remain 19.0 percent below the 5.10 million-unit pace in August 2009.
...
Total housing inventory at the end of August slipped 0.6 percent to 3.98 million existing homes available for sale, which represents an 11.6-month supply at the current sales pace, down from a 12.5-month supply in July.
 Click on graph for larger image in new window.
This graph shows existing home sales, on a Seasonally Adjusted Annual Rate (SAAR) basis since 1993.
Sales in August 2010 (4.13 million SAAR) were 7.6% higher than last month, and were 19.0% lower than August 2009 (5.1 million SAAR).
 The second graph shows nationwide inventory for existing homes.
According to the NAR, inventory decreased slightly to 3.98 million in August from 4.01 million in July. The all time record high was 4.58 million homes for sale in July 2008.
Inventory is not seasonally adjusted and there is a clear seasonal pattern with inventory increasing in the spring and into the summer. I'll have more on inventory later ...
 The last graph shows the 'months of supply' metric.
Months of supply decreased to 11.6 months in August from 12.5 months in July. This is extremely high and suggests prices, as measured by the repeat sales indexes like Case-Shiller and CoreLogic, will continue to decline.
These weak numbers are exactly what I expected. Ignore the median price! Double digit supply and the low sales rate are the key stories. I'll have more ...
Weekly Initial Unemployment Claims increase
by Calculated Risk on 9/23/2010 08:30:00 AM
The DOL reports on weekly unemployment insurance claims:
In the week ending Sept. 18, the advance figure for seasonally adjusted initial claims was 465,000, an increase of 12,000 from the previous week's revised figure of 453,000. The 4-week moving average was 463,250, a decrease of 3,250 from the previous week's revised average of 466,500.
 Click on graph for larger image in new window.
This graph shows the 4-week moving average of weekly claims since January 2000.
The dashed line on the graph is the current 4-week average. The four-week average of weekly unemployment claims decreased this week by 3,250 to 463,250.
The 4-week moving average has been moving sideways at an elevated level for about 10 months - and that suggests a weak job market.
Wednesday, September 22, 2010
Oops! No mortgage and still foreclosed on
by Calculated Risk on 9/22/2010 10:42:00 PM
From Harriet Johnson Brackey at the Sun Sentinel: Man's home sold out from under him in foreclosure mistake (ht Clint)
When Jason Grodensky bought his modest Fort Lauderdale home last December, he paid cash. But seven months later, he was surprised to learn that Bank of America had foreclosed on the house, even though Grodensky did not have a mortgage.Talk about a foreclosure error. I'm surprised a notice wasn't posted on the front door. At least the property wasn't sold to another party on the court house steps - imagine if that 3rd party had shown up with an eviction notice.
Grodensky knew nothing about the foreclosure until July, when he learned that the title to his home had been transferred to a [Fannie Mae]. ... Bank of America has acknowledged the error and will correct it at its own expense, said spokeswoman Jumana Bauwens.
Existing Home Sales Preview
by Calculated Risk on 9/22/2010 07:39:00 PM
Last month it was obvious that the consensus forecast for existing home sales was way too high. For July, the consensus was 4.65 million on a seasonally adjusted annual rate (SAAR) basis, and the National Association of Realtors (NAR) reported sales of 3.83 million SAAR (the lowest sales rate in almost 15 years).
Tomorrow (Thursday), the NAR will report existing home sales for August at 10 AM ET (existing home sales are counted when transactions close). The consensus is for an increase to 4.1 million (SAAR) in August from 3.83 million in July, and down sharply from the 5.1 million SAAR in August 2009.
Housing economist Tom Lawler is also projecting 4.1 million SAAR.
Other key numbers will be the the level of inventory and months-of-supply.
Excluding July, the last time sales were this low was in 1997. And based on the MBA purchase index, I don't expect much of a sales increase in September or October either.


