 RSS Feed
 by Calculated Risk on 7/27/2010 11:13:00 AM
Tuesday, July 27, 2010
Richmond Fed: Manufacturing Activity Moderates in July; Expectations Slip
Note: Usually I don't post all the regional manufacturing surveys, however with the inventory adjustment over, export growth appearing to slow, and domestic consumer demand sluggish, these surveys might provide a hint of weakness in the manufacturing sector.
From the Richmond Fed: Manufacturing Activity Moderates in July; Expectations Slip
In July, the seasonally adjusted composite index of manufacturing activity — our broadest measure of manufacturing — declined seven points to 16 from June's reading of 23. Among the index's components, shipments lost nine points to 22, new orders dropped 12 points to finish at 13, while the jobs index moved up six points to 15.This is similar to the Dallas Fed report yesterday: Texas Manufacturing Activity Remains Sluggish. It appears growth in the manufacturing sector is slowing.
...
Other indicators also suggested somewhat slower activity. The backlog of orders measure moved down two points to 1, and the index for capacity utilization fell eight points to 13.
Q2 2010: Homeownership Rate Lowest Since 1999
by Calculated Risk on 7/27/2010 10:00:00 AM
The Census Bureau reported the homeownership and vacancy rates for Q2 2010 this morning. Here are a few graphs ... Click on graph for larger image in new window.
The homeownership rate declined to 66.9%. This is the lowest level since 1999.
Note: graph starts at 60% to better show the change.
The homeownership rate increased in the '90s and early '00s because of changes in demographics and "innovations" in mortgage lending. The increase due to demographics (older population) will probably stick, so I've been expecting the rate to decline to the 66% to 67% range - and not all the way back to 64% to 65%.
I'll have to revisit this now that the homeownership rate has fallen back to the top of the range I expected!  The homeowner vacancy rate declined to 2.5% in Q2 2010.
A normal rate for recent years appears to be about 1.7%.
This leaves the homeowner vacancy rate about 0.8% above normal. This data is not perfect, but based on the approximately 75 million homeowner occupied homes, we can estimate that there are close to 500 thousand excess vacant homes.
The rental vacancy rate was steady at 10.6% in Q2 2010.  Other reports have suggested that the rental vacancy rate has declined slightly. This report is nationwide and includes homes for rent.
It's hard to define a "normal" rental vacancy rate based on the historical series, but we can probably expect the rate to trend back towards 8%. According to the Census Bureau there are close to 41 million rental units in the U.S. If the rental vacancy rate declined from 10.6% to 8%, then 2.6% X 41 million units or 1.07 million excess units would have to be absorbed.
This suggests there are still about 1.6 million excess housing units. These excess units will keep pressure on housing starts, rents and house prices for some time.
Case-Shiller: House Price indexes increase in May
by Calculated Risk on 7/27/2010 09:00:00 AM
IMPORTANT: These graphs are Seasonally Adjusted (SA). S&P has cautioned that the seasonal adjustment is probably being distorted by irregular factors. These distortions could include distressed sales and the various government programs.
S&P/Case-Shiller released the monthly Home Price Indices for May (actually a 3 month average).
This includes prices for 20 individual cities, and two composite indices (10 cities and 20 cities).
From S&P: For the Past Year Home Prices Have Generally Moved Sideways
Data through May 2010, released today by Standard & Poor’s for its S&P/Case-Shiller1 Home Price Indices, the leading measure of U.S. home prices, show that the annual growth rates in 15 of the 20 MSAs and the 10- and 20-City Composites improved in May compared to those reported for April 2010. The 10-City Composite is up 5.4% and the 20-City Composite is up 4.6%from where they were in May 2009. While 19 MSAs and both Composites reported positive monthly changes in May over April, only 12 of the MSAs and the two Composites saw better month-over-month growth rates in May than those reported in April.
 Click on graph for larger image in new window.
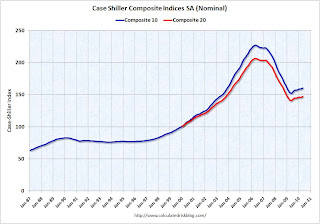
 The first graph shows the nominal seasonally adjusted Composite 10 and Composite 20 indices (the Composite 20 was started in January 2000).
The Composite 10 index is off 29.3% from the peak, and up 1.0% in May (SA).
The Composite 20 index is off 28.7% from the peak, and up 1.1% in May (SA).
 The second graph shows the Year over year change in both indices.
The Composite 10 is up 5.4% compared to May 2009.
The Composite 20 is up 4.6% compared to May 2009.
This is the fourth month with YoY price increases in a row.
The third graph shows the price declines from the peak for each city included in S&P/Case-Shiller indices.
 Prices increased (SA) in 15 of the 20 Case-Shiller cities in May seasonally adjusted.
Prices in Las Vegas are off 56.1% from the peak, and prices in Dallas only off 4.8% from the peak.
Case Shiller is reporting on the NSA data (19 cities with increasing prices), and I'm using the SA data. I'm not sure why S&P calls a 5% increase "moving sideways". Prices are probably starting to fall right now, but this will not show up in the Case-Shiller index for a few months.
Monday, July 26, 2010
Home builders to start building more homes?
by Calculated Risk on 7/26/2010 09:13:00 PM
The following article discusses both new and existing home supply. Here is a short excerpt on new homes ...
From Robbie Whelan at the WSJ: Supply of Homes Set to Grow
Home builders ... are stuck with thousands of acres that are prone to lose value as the market struggles. Many will build homes on the land, rather than write off its value and wait for the market to improve.In some communities with excess supply, home builders are competing with the distressed sales by building smaller homes. As an example, a couple months ago David Streitfeld at the NY Times wrote about a building boom in Las Vegas: In City of Homes That Sit Empty, Building Booms
... "They're discounting the homes, they're making very small profit margins, but they're building homes." [said Brad Hunter, chief economist at Metrostudy]
...
Other indicators also point to builders preparing to increase home construction, despite lagging sales. The number of finished vacant lots, or parcels of land that have been developed and readied for building, stands at about 1.2 million nationwide, according to Metrostudy, or just 5% below the peak in late 2008.
Home prices in Las Vegas are down by 60 percent from 2006 in one of the steepest descents in modern times. There are 9,517 spanking new houses sitting empty. An additional 5,600 homes were repossessed by lenders in the first three months of this year and could soon be for sale.But just because they have the lots, I hope they don't start overbuilding again.
Yet builders here are putting up 1,100 homes, and they are frantically buying lots for even more. ... Land and labor costs have fallen significantly, so the newest homes are competitively priced.
Jim the Realtor: Beach Cheapie?
by Calculated Risk on 7/26/2010 05:57:00 PM
Earlier (with graphs): New Home Sales: Worst June on Record
I haven't checked in with Jim for some time. This 800 sq ft REO is "cheap"?


