 RSS Feed
 by Calculated Risk on 7/14/2010 10:00:00 AM
Wednesday, July 14, 2010
Manufacturing and Trade Inventory-to-Sales Ratio
The Manufacturing and Trade Inventories and Sales report from the Census Bureau today showed that the inventory adjustment is over:
Inventories. Manufacturers’ and trade inventories, adjusted for seasonal variations but not for price changes, were estimated at an end-of-month level of $1,355.7 billion, up 0.1 percent (±0.1%)* from April 2010, but down 1.5 percent (±0.3%) from May 2009.
Inventories/Sales Ratio. The total business inventories/sales ratio based on seasonally adjusted data at the end of May was 1.24. The May 2009 ratio was 1.41.
 Click on graph for larger image in new window.
This graph shows the inventory to sales ratio. This increased slightly in May to 1.24 (SA), after declining sharply from the peak of 1.48 back in Jan 2009. This could decline further - the trend is definitely down over time - but clearly the inventory adjustment is over.
This is important because the change in inventory added significantly to Q4 GDP growth and some to Q1 GDP. See BEA line 13: the contribution to GDP in Q4 2009 from 'Change in private inventories' was 3.79 of the 5.9 percent annualized increase in Q4 GDP. In Q1 2010. the 'change in private inventories' was 1.88 of the 2.7 percent annualized increase.
Any contributions to Q2 GDP from inventory changes will be minor or possibly even negative. This is one of the reasons I expect the change in real GDP growth to slow in the 2nd half.
Retail Sales fall 0.5% in June
by Calculated Risk on 7/14/2010 08:30:00 AM
On a monthly basis, retail sales decreased 0.5% from May to June (seasonally adjusted, after revisions), and sales were up 4.8% from June 2009.  Click on graph for larger image in new window.
This graph shows retail sales since 1992.
This is monthly retail sales, seasonally adjusted (total and ex-gasoline).
Retail sales are up 7.3% from the bottom, but still off 5.2% from the pre-recession peak. The second graph shows the year-over-year change in retail sales (ex-gasoline) since 1993.
Retail sales ex-gasoline increased by 4.5% on a YoY basis (4.8% for all retail sales). The year-over-year comparisons are easy now since retail sales collapsed in late 2008.
Here is the Census Bureau report:
The U.S. Census Bureau announced today that advance estimates of U.S. retail and food services sales for June, adjusted for seasonal variation and holiday and trading-day differences, but not for price changes, were $360.2 billion, a decrease of 0.5 percent (±0.5%)* from the previous month, but 4.8 percent (±0.7%) above June 2009. Total sales for the April through June 2010 period were up 6.8 percent (±0.3%) from the same period a year ago. The April to May 2010 percent change was revised from -1.2 percent (±0.5%) to -1.1 percent (±0.2%).Retail sales have declined for two consecutive months. This is another weak report, and the decline in sales was worse than expected.
MBA: Mortgage Purchase Applications lowest since December 1996
by Calculated Risk on 7/14/2010 07:46:00 AM
The MBA reports: Mortgage Applications Decrease in Latest MBA Weekly Survey
The Refinance Index decreased 2.9 percent from the previous week and the seasonally adjusted Purchase Index decreased 3.1 percent from one week earlier. This was the lowest Purchase Index observed in the survey since December 1996.
...
The average contract interest rate for 30-year fixed-rate mortgages increased to 4.69 percent from 4.68 percent, with points increasing to 0.96 from 0.86 (including the origination fee) for 80 percent loan-to-value (LTV) ratio loans.
 Click on graph for larger image in new window.
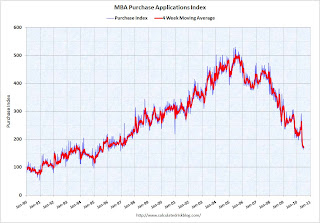
This graph shows the MBA Purchase Index and four week moving average since 1990.
Mortgage applications have fallen off a cliff. The weekly applications index is at the lowest level since December 1996, and and the four week average is at the lowest level since September 1995 - almost 15 years ago. The four week average is off 35% since the mini-peak in April (the weekly index is off 44% since the end of April).
This collapse in the mortgage application index has already shown up as a decline in new home sales, and will show up in the July existing home sales report (counted at close of escrow).
Tuesday, July 13, 2010
Fed Minutes Preview
by Calculated Risk on 7/13/2010 10:29:00 PM
Usually the Fed minutes are pretty boring, but the minutes for the two day meeting held on June 22nd and 23rd, to be released on Wednesday, might be a little more interesting.
This release will include a revised forecast. Look for the Fed to revise down estimates for GDP and for inflation. And revise up estimates for unemployment.
The Fed April forecast for 2010 (most recent) was:
Also the Fed might have discussed possible additional easing measures at the June meeting, and if so, it will be interesting to see the options discussed.
Jon Hilsenrath at the WSJ has a preview: Fed Sees Slower Growth
From Steve Matthews and Carol Massar at Bloomberg: Blinder Cuts U.S. Forecast, Says Fed Must Plan for More Easing (ht jb)
Some European Stress Test Results may be delayed
by Calculated Risk on 7/13/2010 07:02:00 PM
From James Kanter at the NY Times: European Bank Stress Test Results May Be Delayed
Top European finance officials said Tuesday that results of banking stress tests would be released on July 23, but that some national regulators could take longer to release more detailed information on certain national lenders ... national regulators will retain the leeway to choose whether to publish additional information about the nationally based subsidiaries of large banking groups within two weeks from July 23.Sounds confusing ...


