 RSS Feed
 by Calculated Risk on 6/15/2010 05:55:00 PM
Tuesday, June 15, 2010
SoCal Home sales at 4 Year High
From DataQuick: Southland sales at 4-year high
Note: as always I ignore the median price and use the repeat sales indexes from Case-Shiller and CoreLogic.
Southern California home sales rose last month in all but the lowest price categories as buyers took advantage of tax credits and low mortgage rates. ... A total of 22,270 new and resale houses and condos closed escrow in Los Angeles, Riverside, San Diego, Ventura, San Bernardino and Orange counties last month. That was up 9.7 percent from 20,299 in April, and up 7.2 percent from 20,775 in May 2009, according to MDA DataQuick of San Diego.And here is the dumb headline of the day: Southern California median home price surges 22.5% (ht JBR). So what? That just says the mix changed ... and that is because the distressed sales are moving on up to higher priced neighborhood.
May sales were the highest for that month since May 2006, but they still fell 15.0 percent short of the average number sold in May since 1988, when DataQuick’s statistics begin. The 9.7 percent increase in sales between April and May compares with an average change of 6 percent since 1988.
...
“The important thing to remember, though, is that what we saw in May was partly driven by government stimulus,” he continued. “In the second half of the year the market will have to stand on its own again, barring new forms of government involvement. Prices will be tested if there’s any sudden move by lenders to release a flood of distressed properties.”
Foreclosure resales accounted for 33.9 percent of the resale market last month, down from 36.4 percent in April and 49.8 percent a year earlier. The all-time high for foreclosure resales – homes that had been foreclosed on in the prior 12 months – was 56.7 percent in February 2009. Foreclosure resales have waned over the last year as lenders have channeled more distress into loan modifications and short sales.
...
Foreclosure activity remains high by historical standards but is lower than peak levels reached over the last two years.
What matter is this is probably the high point for sales this year. This report includes both new and existing home sales, and new home sales are counted when the contract is signed (peaked in April) and existing home sales are counted when the transaction closes (will peak in May or June).
Employment and Real GDP, Real GDI
by Calculated Risk on 6/15/2010 03:47:00 PM
Last night I excerpted from a speech by St Louis Fed President James Bullard. I noted that GDI might be more useful in measuring the recovery than GDP (they are conceptually equivalent).
As a followup to that post (and also to the previous post with the forecast from UCLA-Anderson's Ed Learmer), here are two graphs looking at payroll employment vs. the change in real GDP and real GDI.
At the bottom of this post are estimates of the unemployment rate in 12 months for several growth scenarios. Note: This is similar to Okun's relationship between GDP and unemployment.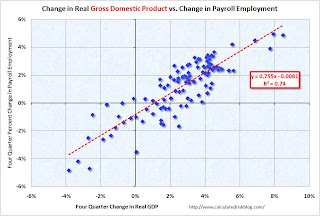 Click on graph for larger image.
The first graph shows the four quarter change in real GDP vs. the four quarter change in employment, as a percent of payroll employment (to normalize for changes in payroll over time).
The second graph shows the same relationship, but uses Gross Domestic Income instead of GDP. There is a clear relationship - the higher the change in the real GDP or real GDI, the larger the increase in payroll employment. The R2 for GDI is slightly higher than for GDP (0.80 vs. 0.74).
This shows that real GDP / real GDI has to grow at a sustained rate of about 1% just to keep the net change in payroll jobs at zero.
A 3% increase in real GDI (over a year) would lead to about a 1.4% increase in payroll employment. With approximately 130 million payroll jobs, a 1.4% increase in payroll employment would be just over 1.8 million jobs over the next year - and the unemployment rate would probably remain close to the current level (9.7%) depending on changes in population and the participation rate.
The following table summarizes several growth scenarios. The unemployment rate is from the household survey and depends on the number of people in the work force - so it cannot be calculated directly. The table uses a range of unemployment rates based on 1.6 to 2.1 million people entering the workforce over the next 12 months (a combination of population growth and discouraged workers reentering the work force).
NOTE: For those interested in understanding the differences between the household and establishment employment surveys - and why the unemployment rate cannot be calculated directly from the payroll report, see: Jobs and the Unemployment Rate
| Real Growth | Percent Payroll Growth | Annual Payroll Growth (000s) | Monthly Payroll Growth (000s) | Unemployment Rate in One Year1 |
|---|---|---|---|---|
| 6.0% | 3.6% | 4648 | 387 | 7.6% to 7.9% |
| 5.0% | 2.9% | 3718 | 310 | 8.2% to 8.5% |
| 4.0% | 2.1% | 2787 | 232 | 8.8% to 9.1% |
| 3.0% | 1.4% | 1857 | 155 | 9.4% to 9.7% |
| 2.0% | 0.7% | 926 | 77 | 10.0% to 10.3% |
| 1.0% | 0.0% | -4 | 0 | 10.6% to 10.9% |
| 1The unemployment rate is from the Household Survey and depends on several factors including changes in population and the participation rate. | ||||
I think Leamer is a little optimistic for 2010 - I'm expecting a 2nd half slowdown in GDP growth this year - and I think the unemployment rate will stay near the current level for some time.
UCLA's Leamer: "A Homeless Recovery"
by Calculated Risk on 6/15/2010 12:14:00 PM
From UCLA: UCLA Anderson Forecast: U.S. recovery a long, slow climb; Calif. recovery weaker than nation's
"If the next year is going to bring exceptional growth," [UCLA Anderson Forecast director Edward] Leamer writes, "consumers will need to express their optimism in the way that really counts — buying homes and cars. And that is not going to happen if businesses continue to express their pessimism in the way that really counts — by not hiring workers."A couple of key points:
The result is an economic Catch-22.
Leamer explains that significant reductions in the unemployment rate require real gross domestic product (GDP) growth in the 5.0 percent to 6.0 percent range. Normal GDP growth is 3.0 percent, enough to sustain unemployment levels, but not strong enough to put Americans back to work. As a consequence, consumers concerned about their employment status are reluctant to spend, and businesses concerned about growth are reluctant to hire.
The forecast for GDP growth this year is 3.4 percent, followed by 2.4 percent in 2011 and 2.8 percent in 2012, well below the 5.0 percent growth of previous recoveries and even a bit below the 3.0 percent long-term normal growth. With this weak economic growth comes a weak labor market, and unemployment slowly declines to 8.6 percent by 2012.
NAHB Builder Confidence declines sharply in June
by Calculated Risk on 6/15/2010 10:00:00 AM
Note: any number under 50 indicates that more builders view sales conditions as poor than good.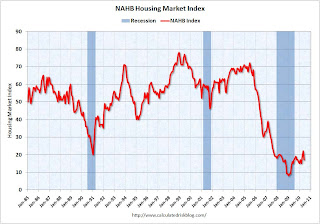 Click on graph for larger image in new window.
This graph shows the builder confidence index from the National Association of Home Builders (NAHB).
The housing market index (HMI) was at 17 in June. This was a sharp decline from 22 in May.
The record low was 8 set in January 2009. This is still very low ... This second graph compares the NAHB HMI (left scale) with single family housing starts (right scale). This includes the June release for the HMI and the April data for starts (May starts will be released tomorrow).
This shows that the HMI and single family starts mostly move generally in the same direction - although there is plenty of noise month-to-month.
Press release from the NAHB: Builder Confidence Declines in June
Snapping a string of two consecutive monthly gains, builder confidence in the market for newly built, single-family homes fell back to February levels, before the beginning of the home buyer tax credit-related surge, according to results of the latest National Association of Home Builders/Wells Fargo Housing Market Index (HMI), released today. The HMI dropped five points to 17 in June.This suggests single family starts will decline sharply soon.
“The home buyer tax credit did its job in stoking spring sales and we expected a temporary pull back in the builders’ outlook after the credit expired at the end of April,” said NAHB Chairman Bob Jones, a home builder from Bloomfield Hills, Mich. “However, the reduction in consumer activity may have been more dramatic than some builders had anticipated, which resulted in their lower confidence levels.”
...
Each of the HMI’s component indexes recorded declines in June. The component gauging current sales conditions fell five points to 17, while the component gauging sales expectations for the next six months declined four points to 23 (from a one-point downward revised index level of 27 in May) and the component gauging traffic of prospective buyers fell two points to 14.
The HMI also posted losses in every region in June. The Northeast, which has the smallest survey sample and is therefore subject to greater month-to-month volatility, fell 17 points to 18 following a 14-point jump in May. The Midwest posted a three-point loss to 14, while the South also registered a three-point decline to 19 and the West fell four points to 15 from a revised May level of 19.
NY Fed: Manufacturing Conditions improve in June
by Calculated Risk on 6/15/2010 08:30:00 AM
From the NY Fed: Empire State Manufacturing Survey
The Empire State Manufacturing Survey indicates that conditions for New York manufacturers improved in June. The general business conditions index edged up from its May level to 19.6, extending its string of positive readings to eleven months. The new orders and shipments indexes were also positive and higher than their May levels. The inventories index remained near zero for a second straight month, indicating that inventory levels were little changed.This came in slightly below expectations. This is more evidence that the inventory adjustment is over. Manufacturing continued to improve, although at a somewhat slower pace than earlier this year.
...
The new orders index rose modestly, to 17.5, and the shipments index climbed to 19.7. The unfilled orders index was negative for a third consecutive month, at -1.2.
...
The index for number of employees slipped 10 points, to 12.4, and the average workweek index climbed from zero last month to 8.6.


