 RSS Feed
 by Calculated Risk on 6/08/2010 10:00:00 AM
Tuesday, June 08, 2010
BLS: Low Labor Turnover, Job Openings Increase in April
From the BLS: Job Openings and Labor Turnover Summary
There were 3.1 million job openings on the last business day of April 2010, the U.S. Bureau of Labor Statistics reported today. The job openings rate increased over the month to 2.3 percent. The hires rate (3.3 percent) and the separations rate (3.1 percent) were unchanged.Note: The difference between JOLTS hires and separations is similar to the CES (payroll survey) net jobs headline numbers. The CES (Current Employment Statistics, payroll survey) is for positions, the CPS (Current Population Survey, commonly called the household survey) is for people.
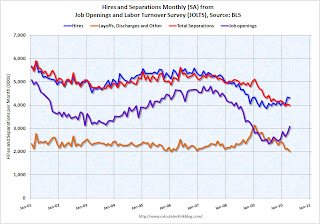
The following graph shows job openings (purple), hires (blue), Total separations (include layoffs, discharges and quits) (red) and Layoff, Discharges and other (yellow) from the JOLTS.
Unfortunately this is a new series and only started in December 2000.
 Click on graph for larger image in new window.
Notice that hires (blue) and separations (red) are pretty close each month. Right now about 4 million people lose their jobs each month, and over 4 million are hired (this is the labor turnover in the economy).
When the hires (blue line) is above total separations (as in April), the economy is adding net jobs, when the blue line is below total separations, the economy is losing net jobs.
According to the JOLTS report, there were 4.304 million hires in April (SA), and 4.000 million total separations, or 304 thousand net jobs gained. The comparable CES report showed a gain of 290 thousand jobs in April (after revision).
Note: Hires include Census 2010 temporary hires.
Layoffs and discharges have declined sharply from early 2009 - and are near a series low - and that is a good sign. And the number of job openings increased sharply in April, although the level is still pretty low.
Job openings and "layoffs and discharges" have been improving, but the overall labor turnover is still low.
Small Business Optimism improves slightly in May
by Calculated Risk on 6/08/2010 08:34:00 AM
From NFIB: Small Business Optimism Increases But Not Enough to Spur Hiring, Capital Spending
The National Federation of Independent Business Index of Small Business Optimism gained 1.6 points in May with a reading of 92.2. Although not a strong sign of recovery, it is headed in the right direction. It is the best reading since September 2008’s 92.9 index that occurred just before the five-point decline in October that started the rapid deterioration in the fourth quarter of 2008. In May, seven of the 10 index components rose, but job creation and capital expenditure plans barely gained and remained at recession levels.The outlook has improved, but the recovery is sluggish and hiring is "bleak".
“The performance of the economy is mediocre at best,” said William C. Dunkelberg, NFIB’s chief economist.
...
In May, firms still shed workers ... The small business sector is not contributing to private sector employment growth.
“"The recovery in optimism we are currently experiencing is very weak compared to recoveries after 1982 or 1975."Note: although the press release doesn't mention it, there is a heavy concentration of construction related businesses in the small business sector - and obviously that is one of the weakest sectors.
Monday, June 07, 2010
Bernanke: Economy "won't feel terrific"
by Calculated Risk on 6/07/2010 11:30:00 PM
From Sewell Chan at the NY Times: Bernanke Forecasts a Fitful Recovery
“My best guess is that we’ll have a continued recovery, but it won’t feel terrific,” Mr. Bernanke told the broadcast journalist Sam Donaldson in a question-and-answer session at the Woodrow Wilson International Center for Scholars.The Asian markets are up somewhat tonight.
...
“Even though technically we’ll be in recovery and the economy will be growing, unemployment will still be high for a while and that means that a lot of people will be under financial stress,” he said.
The CNBC Pre-Market Data shows the S&P 500 up about 5 points and the Dow futures are up about 40 points.
The Euro is up slightly at 1.196 dollars
Best to all.
Distressed Sales: Sacramento as an Example, May 2010
by Calculated Risk on 6/07/2010 06:42:00 PM
The Sacramento Association of REALTORS® is breaking out monthly resales by equity sales (conventional resales), and distressed sales (Short sales and REO sales), and I'm following this series as an example to see mix changes in a distressed area. 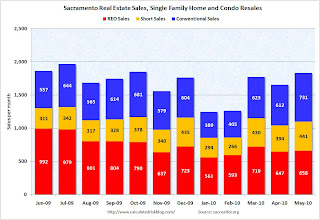 Click on graph for larger image in new window.
Here is the May data.
The Sacramento Association started breaking out REO sales in 2008, but they have only broken out short sales since June 2009 - so we now have one year of data.
In May, 60.1% of all resales (single family homes and condos) were distressed sales. This is the lowest level over the last year.
Note: This data is not seasonally adjusted.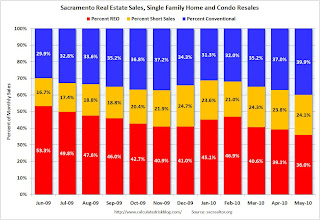 The second graph shows the percent of REO, short sales and conventional sales. The percent of short sales is near the high set in December and will probably continue to increase later this year (2010 is the year of the short sale!).
The percent of REOs has been generally declining (seasonally there are a larger percentage of REOs in the winter). Also there appears to be a higher percentage of conventional sales associated with the tax credit.
Also total sales in May were off 1.8% compared to May 2009; the 12th month in a row with declining YoY sales - even with the tax credit buying this year!
On financing, 57 percent were either all cash (23.3%) or FHA loans (33.6%), suggesting most of the activity in distressed former bubble areas like Sacramento is first time home buyers using government-insured FHA loans, and investors paying cash.
Starting in June we can do some year-over-year comparisons. It appears short sales will be up substantially YoY and REOs down, and it will be interesting to see the level of total distressed sales once the tax credit buying is behind us (July).
Rail Traffic Softens in May
by Calculated Risk on 6/07/2010 03:49:00 PM
From the Association of American Railroads: Rail Time Indicators. The AAR reports traffic in May 2010 was up 15.8% compared to May 2009 - and traffic was still 11.8% lower than in May 2008. Click on graph for larger image in new window.
This graph shows U.S. average weekly rail carloads. Traffic increased in 18 of 19 major commodity categories YoY.
From AAR:
• U.S. freight railroads originated 1,153,675 carloads in May 2010, an average of 288,419 carloads per week. That’s up 15.8% from May 2009 (which is the second highest percentage gain ever, behind April 2010 — see chart ...) but down 11.8% from May 2008.As the graph above shows, rail traffic collapsed in November 2008, and now eleven months into the recovery, traffic has only recovered about half way. This is more evidence of a sluggish recovery ... and the decline in May is concerning, although one month does not make a trend (and May was "a bit overstated" due to the timing of Memorial Day).
• U.S. railroads averaged 294,758 carloads per week in April 2010 and 288,793 in March 2010. Thus, May 2010’s average was actually down slightly from those months ... One month does not a trend make, but it would obviously be worrisome if the decline continued.
• As was the case in April 2010, the big year-over-year percentage gains in May 2010 U.S. rail traffic were partly a function of easy comparisons (May 2009 was a miserable month for rail traffic) and partly a function of real traffic growth.
• For the purposes of AAR rail traffic data, May 2010 consists of the four weeks ending May 29 — i.e., it does not include Memorial Day, which was May 31 this year. However, the May 2009 and May 2008 comparison months do include Memorial Day. The net result is that May 2010 data is a bit overstated relative to the two previous years, and June 2010 will be a bit understated relative to the two previous years. It is impossible to know exactly how much rail traffic is affected.
excerpts with permission


