 RSS Feed
 by Calculated Risk on 6/04/2010 04:00:00 PM
Friday, June 04, 2010
Fannie Mae economist: House "price appreciation not supportable" and more
“Temporary tax credits change behavior temporarily. It’s simply shifted
demand forward. ... It actually created some price appreciation that’s not
supportable long term.”
Douglas Duncan, Fannie Mae Chief Economist, June 4, 2010 via Bloomberg (ht Brian)
And more on condo shadow inventory in New York from Bloomberg: Manhattan Empty Condos May Be Rentals as Leases Reign (ht Mike In Long Island)
About 8,700 new condos sit empty in Manhattan, with 75 percent not even listed for sale yet ... Developers taking out construction loans borrow an additional amount for interest reserves, which is intended to cover the monthly payments on the loan while the project is under construction and until sales begin ... reserves on loans made in 2007 and 2008 will dwindle in the second half of 2010 and early 2011.We've discussed this before - the flood comes when the interest reserves run dry.
The euro is down to 1.196 dollars. This is the lowest level since March 2006.
The TED spread increased to 41.59 (a measure of credit stress). This is still fairly low, but this is the highest level in eleven months. Note: This is the difference between the interbank rate for three month loans and the three month Treasury. The peak was 463 on Oct 10th and a normal spread is below 50 bps.
 Click on graph for larger image in new window.
This is a slightly different graph from Doug Short of dshort.com (financial planner).
This graph shows the ups and downs of the market since the high in 2007.
Earlier employment posts today:
Temporary Help Services starting to slow, Small Business hiring "Bleak"
by Calculated Risk on 6/04/2010 01:17:00 PM
One more graph based on data in the employment report ...
Earlier employment posts today:
Temporary Help
From the BLS report:
Temporary help services added 31,000 jobs over the month; employment in the industry has risen by 362,000 since September 2009.
 This graph is a favorite of those expecting a huge rebound in employment. The graph is a little complicated - the red line is the three month average change in temporary help services (left axis). This is shifted four months into the future.
The blue line (right axis) is the three month average change in total employment (excluding temporary help services and Census hiring).
Unfortunately the data on temporary help services only goes back to 1990, but it does appear that temporary help leads employment by about four months (although noisy).
The thinking is that before companies hire permanent employees following a recession, employers will first increase the hours worked of current employees (hours worked increased again in May) and also hire temporary employees.
Since the number of temporary workers increased sharply late last year, some people argued this was signaling the beginning of a strong employment recovery - probably in April and May. It didn't happen.
There was also evidence of a shift by employers to more temporary workers, and the joke in the comments was "We are all temporary now!". That is probably closer to the mark. The timing of this graph is useful - temporary help services does lead general employment - but the magnitude of the swings is probably less useful.
Small Business Hiring "Bleak"
The National Federation of Independent Business released the employment outlook from their May survey: Small Business Still Reluctant to Hire
“Since January 2008, the average employment per firm has been negative every month, including May 2010, which yielded a seasonally adjusted loss of negative 0.5 workers per firm. Most firms did not change employment in May, but for those that did, 8 percent increased average employment by 2.4 employees and 20 percent reduced their workforces by an average of 4 employees. Small business job creation has not crossed the 0 line in over 2 years."
...
“Overall, the job creation picture is still bleak. Poor sales and uncertainty continue to hold back any commitments to growth, hiring or capital spending. Job creation plans have been running far below comparable quarters in the recovery from two other major recessions."
Euro falls under 1.20 Dollars, Hungary “manipulated” figures
by Calculated Risk on 6/04/2010 11:45:00 AM
A break from the employment report ...
Update: a couple of Hungarian readers have told me the translation was out of context (ht Gabor, Greg). Here is a different translation:
"It was prime minister Ferenc Gyurcsany [previous prime minister of the now opposition Socialist Party] who talked about default. Indeed, he even remarked proudly that Hungary was on the verge of default one and a half years ago ... and he was proud that he could only save Hungary from default with the help of IMF. In this regard it’s not an exaggeration to talk about default.”So the spokesman was apparently referring to the comments of the previous prime minister, and not talking about default now.
Also the readers said the figures that were "manipulated" were forecasts of deficit (not actual deficit like Greece).
The euro fell to under 1.20 dollars this morning as Hungary spooked investors.
From Bloomberg: Sovereign Credit-Default Swaps Surge on Hungarian Debt Crisis
Credit-default swaps on sovereign bonds surged to a record on speculation Europe’s debt crisis is worsening after Hungary said it’s in a “very grave situation” because a previous government lied about the economy ... a spokesman for Prime Minister Viktor Orban said talk of a default is “not an exaggeration” because a previous administration “manipulated” figures.
Employment-Population Ratio, Part Time Workers, Unemployed over 26 Weeks
by Calculated Risk on 6/04/2010 09:59:00 AM
Here are a few more graphs based on the employment report ...
Percent Job Losses During Recessions, aligned at Bottom Click on graph for larger image.
This graph shows the job losses from the start of the employment recession, in percentage terms - but this time aligned at the bottom of the recession.
The current recession bounced along the bottom for a few months - so the choice of bottom is a little arbitrary (plus or minus a month or two).
Notice that the 1990 and 2001 recessions were followed by jobless recoveries - and the eventual job recovery was gradual. In earlier recessions the recovery was somewhat similar and a little faster than the decline (somewhat symmetrical).
The dotted line shows the impact of Census hiring. In May, there were 564,000 temporary 2010 Census workers on the payroll. Starting in June, the number of Census workers will decline - and the two red lines will meet later this year.
Employment-Population Ratio
The Employment-Population ratio decreased to 58.7% in May (from 58.8% in April). This had been increasing after plunging since the start of the recession. This is about the same level as in December 1983. This graph shows the employment-population ratio; this is the ratio of employed Americans to the adult population.
Note: the graph doesn't start at zero to better show the change.
The Labor Force Participation Rate decreased to 65.0% from 65.2% in April. This is the percentage of the working age population in the labor force. This decline is disappointing, and the rate is well below the 66% to 67% rate that was normal over the last 20 years.
The reason the unemployment rate declined was because people left the workforce - and that is not good news. As the employment picture improves, people will return to the labor force, and that will put upward pressure on the unemployment rate.
Part Time for Economic Reasons 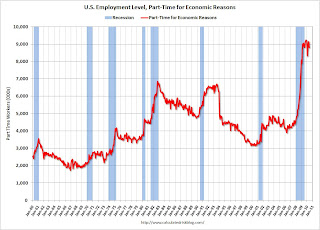 From the BLS report:
The number of persons employed part time for economic reasons (some-times referred to as involuntary part-time workers) declined by 343,000 in May to 8.8 million. These individuals were working part time because their hours had been cut back or because they were unable to find a full-time job.The number of workers only able to find part time jobs (or have had their hours cut for economic reasons) was at 8.809 million in April. This decline was a little bit of good news.
The all time record of 9.24 million was set in October.
These workers are included in the alternate measure of labor underutilization (U-6) that was at 16.6% in May.
Unemployed over 26 Weeks
 The blue line is the number of workers unemployed for 27 weeks or more. The red line is the same data as a percent of the civilian workforce.
According to the BLS, there are a record 6.763 million workers who have been unemployed for more than 26 weeks (and still want a job). This is a record 4.38% of the civilian workforce. (note: records started in 1948). It does appear the increases are slowing ...
Although the headline number of 431,000 payroll jobs was large, this was only 20,000 after adjusting for the 411,000 Census 2010 temporary hires. The underlying details were mixed. The positives: the unemployment rated decreased to 9.7%, the number of part time workers (for economic reasons) decreased helping to push down U-6 to 16.6% (from 17.1%), hourly wages increased (slightly), as did the average hours worked.
Negatives include the employment-population rate declining, the few payroll jobs ex-Census, and a record number of workers unemployed for more than 26 weeks. The number of long term unemployed is one of the key stories of this recession, especially since many of them are now losing their unemployment benefits.
I'll have even more later ...
Earlier employment post today:
May Employment Report: 20K Jobs ex-Census, 9.7% Unemployment Rate
by Calculated Risk on 6/04/2010 08:30:00 AM
From the BLS:
Total nonfarm payroll employment grew by 431,000 in May, reflecting the hiring of 411,000 temporary employees to work on Census 2010, the U.S. Bureau of Labor Statistics reported today. ... The unemployment rate edged down to 9.7 percent.Census 2010 hiring was 411,000 in May. Non-farm payroll employment increased 20,000 in May ex-Census.
 Click on graph for larger image.
This graph shows the unemployment rate and the year over year change in employment vs. recessions.
Nonfarm payrolls increased by 431,000 in May. The economy has lost 0.6 million jobs over the last year, and 7.4 million jobs since the recession started in December 2007. Ex-Census hiring, the economy only added 20,000 jobs in May.
The unemployment rate decreased to 9.7 percent.
 The second graph shows the job losses from the start of the employment recession, in percentage terms (as opposed to the number of jobs lost).
The dotted line is ex-Census hiring. The two lines will rejoin later this year when the Census hiring is unwound.
For the current recession, employment peaked in December 2007, and this recession is by far the worst recession since WWII in percentage terms, and 2nd worst in terms of the unemployment rate (only early '80s recession with a peak of 10.8 percent was worse).
This is a very weak report. The decrease in the unemployment rate was because of a decline in the participation rate - and that is not good news. I'll have much more soon ...


