 RSS Feed
 by Calculated Risk on 5/16/2010 11:59:00 AM
Sunday, May 16, 2010
Weekly Summary and a Look Ahead
Three housing related reports will be released early this week: the NAHB builder confidence survey on Monday, housing starts on Tuesday, and the MBA Q1 delinquency report on Wednesday. Of course Europe will still be in the spotlight too.
On Monday, the May Empire State manufacturing survey will be released at 8:30 AM. The consensus is for a slight decline from the strong reading in April. Also on Monday, the May NAHB homebuilder survey will be released at 1 PM. The consensus is for a slight increase to 20 from 19 in April.
On Tuesday, Housing Starts for April will be released at 8:30 AM. The consensus is for an increase to 650K (SAAR) in April from 626K in March. Also at 8:30 AM, the BLS will release the Producer Price Index (PPI) for April. The consensus is for an increase of 0.1%. The Census Bureau will also release the Q1 Quarterly Starts and Completions report.
Also on Tuesday, Cleveland Fed President Sandra Pianalto speaks at the Economic Club of Pittsburgh at 12:20 PM , and former Fed Chairman Paul Volcker speaks at Stanford University at 9:45 PM. It was five years ago – at Stanford – that Volcker remarked that “circumstances seem as dangerous and intractable as I can remember" and "homeownership has become a vehicle for borrowing and leveraging as much as a source of financial security". That speech is still worth reading.
On Wednesday, the Q1 MBA delinquency report will be released at 10 AM. The big news last quarter was the decline in 30 day delinquencies, and expectations are for further declines – although long term delinquencies will still be a problem. I’ll be on the conference call at 10:30 AM.
Also on Wednesday, the April Consumer Price Index (CPI) will be released at 8:30 AM. The consensus is for a 0.1% increase in prices. Also the AIA's Architecture Billings Index for April will be released (a leading indicator for commercial real estate). The FOMC minutes for the April meeting will be released at 2 PM.
On Thursday, the closely watched initial weekly unemployment claims will be released. Consensus is for a decline to 440K from 444K last week. Also on Thursday, the Philly Fed survey and the Conference Board's index of leading indicators will both be released at 10 AM.
And on Friday, the BLS will release the Regional and State Employment and Unemployment report for April at 10 AM. And of course the FDIC will probably have another busy Friday afternoon ...
Note: Other reports that will probably be released this week include the Moodys/REAL Commercial Property Price Index (for March), the HAMP April report, DOTs Vehicle Miles Driven for March, and the First American Corelogic distressed sales report for February.
And a summary of last week:
The EU announced a total bailout package of €750 billion (if needed). This story is ongoing ...
1) The EU created a €60 billion fund based on article 122 (special circumstances). The IMF will add €30 billion. Press conference archive here (40 minutes)
2) The EU will create a Special Purpose Vehicle (SPV) for 3 years based on inter government agreements. These are potential loan guarantees backed by all Euro Zone countries. This is in addition to €60 billion and will be up to €440 billion - plus a contribution from the IMF up to half of European Union contribution (up to €220 billion).
3) Both Portugal and Spain announced steps to reduce their deficits.
4) The European Central Bank (ECB) intervened "in the euro area public and private debt securities markets (Securities Markets Programme) to ensure depth and liquidity in those market segments which are dysfunctional."
5) The Federal Reserve reopened swap lines to provide dollar liquidity.
6) Deutsche Bank CEO expressed doubts about Greece
7) ECB's Trichet called this the "most difficult situation" since the World War.
 Click on graph for larger image in new window.
This graph shows the REO inventory for Fannie, Freddie and FHA through Q1 2010.
Even with all the delays in foreclosure, the REO inventory has increased sharply over the last three quarters, from 135,868 at the end of Q2 2009, to 153,007 in Q3 2009, 172,357 at the end of Q4 2009 and now 209,500 at the end of Q4 2010.
These are new records for all three agencies.
Remember this is just a portion of the total REO inventory. Private label securities and banks and thrifts hold an even larger number of REOs.
 On a monthly basis, retail sales increased 0.4% from March to April (seasonally adjusted, after revisions), and sales were up 8.8% from April 2009 (easy comparison).
This graph shows retail sales since 1992. This is monthly retail sales, seasonally adjusted (total and ex-gasoline).
The red line shows retail sales ex-gasoline and shows the increase in final demand ex-gasoline has been sluggish.
Retail sales are up 9.2% from the bottom, but still off 3.6% from the pre-recession peak.
 From the Fed: Industrial production and Capacity Utilization
 This graph shows industrial production since 1967.
This is the highest level for industrial production since Dec 2008, but production is still 9.0% below the pre-recession levels at the end of 2007.
First American CoreLogic released the Q1 2010 negative equity report this week.
 This graph shows the negative equity and near negative equity by state.
 Ten percent or more of homeowners have negative equity in 33 states and the D.C., and over 20% have negative equity or near negative equity in 23 states and D.C. This is a widespread problem.
Note: Louisiana, Maine, Mississippi, South Dakota, Vermont, West Virginia and Wyoming are NA on the graph above.
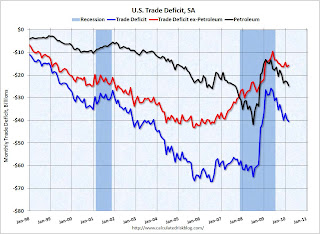 This graph shows the U.S. trade deficit, with and without petroleum, through March.
The blue line is the total deficit, and the black line is the petroleum deficit, and the red line is the trade deficit ex-petroleum products.
Both imports and exports have been increasing sharply, but are still below the pre-financial crisis levels. Once again China and oil are the major contributors to the trade deficit.
Best wishes to all.
Shiller on a Double Dip Recession
by Calculated Risk on 5/16/2010 08:51:00 AM
Professor Shiller is worried about social psychology (I tend to be much more data driven).
From Robert Shiller in the NY Times: Fear of a Double Dip Could Cause One
[T]here is still a real risk of a double-dip recession, though it can’t be quantified by the statistical models that economists use for forecasts. Instead, the danger stems from the weakness and vulnerability of confidence — whose decline could bring markets down, further stress balance sheets and cause cuts in consumption, investment and local government expenditures.
...
From 2007 to 2009, there was widespread concern about the risk of an economic depression, but that scare has been abating. Since mid-2009, it has been replaced by the milder worry of a double-dip recession, as a count of Web searches for those terms on Google Insights suggests. And with that depression scare still fresh in our minds, sensitivity to the possibility of another downturn remains high.
Shiller continues:
I use a definition of a double-dip recession that doesn’t emphasize the short term. Instead, I see it as beginning with a recession in which unemployment rises to a high level and then falls at a disappointingly slow rate. Before employment returns to normal, there is a second recession. As long as economic recovery isn’t complete, that’s a double-dip recession, even if there are years between the declines.It helps to have a clear definition of a "double-dip" as opposed to calling two separate recessions. The two early '80s recession raised this issue, and the NBER argued they were two separate recessions:
Although not all economic indicators had regained their 1979-80 peaks by the summer of 1981, the committee agreed that the resurgence of economic activity in the previous year clearly constituted a business cycle recovery.Using Shiller's definition, the two recessions in the '30s were a "double-dip", although NBER called them as two separate recessions.
My definition of a "double-dip" is a second economic downturn before most of the major indicators return to the pre-recession levels. These measures would include GDP, real income, employment, industrial production, and wholesale-retail sales. My view is the economy will probably slow in the 2nd half of 2010, but I think we will avoid a double-dip.
And this is interesting:
Since 1989, I have been compiling the Buy-on-Dips Stock Market Confidence Index, now produced by the Yale School of Management. It shows that confidence to buy on market dips has been declining steadily for individual investors since 2009. (The measure is holding steady for institutional investors.) Will individuals continue to support the market, which is now highly priced?
Saturday, May 15, 2010
More Accidental Landlords
by Calculated Risk on 5/15/2010 07:54:00 PM
From Sharon Stangenes at the Chicago Tribune: Renting what you can't sell
When Ed Amaya put his Oak Park bungalow up for sale in mid-2007, homes in his neighborhood sold in a matter of days, weeks at the most.Like so many others, he should have reduced the price!
"We had some showings; got close to a deal," recalled Amaya. But as the housing market soured, a sale proved elusive. So Amaya agreed to rent it to a family that was not in a position to buy.
"We stayed in that pattern for a couple of years," said Amaya, who expected real estate to rebound. "But guess what? The market got worse."
Like many homeowners in the housing downturn, Amaya became an unintentional landlord by renting out a property he once hoped to sell.
So many residences are now for lease that there is "a saturated rental market," with more available units than potential tenants, said Jeanine McShea, president of brokerage services for @Properties.My definition of "shadow inventory" are units that aren't currently listed on the market, but will probably be listed soon. This includes REOs, foreclosures in process and some percentage of seriously delinquent loans (some will cure, some are already listed as short sales), unlisted new high rise condos (these properties are not included in the new home inventory report) and homeowners waiting for a better market.
"Many people are renting out property, but most are not making money," said Sara Benson, a principal in Chicago-based Benson Stanley Realty.
That last category includes all the accidental landlords that we've been discussing for years.
Too many homes? Build more ...
by Calculated Risk on 5/15/2010 02:52:00 PM
From David Streitfeld in the NY Times: In City of Homes That Sit Empty, Building Booms
Home prices in Las Vegas are down by 60 percent from 2006 in one of the steepest descents in modern times. There are 9,517 spanking new houses sitting empty. An additional 5,600 homes were repossessed by lenders in the first three months of this year and could soon be for sale.Many buyers have been frustrated recently trying to buy homes, especially at the low end. They are competing with cash buyers, or they have to endure endless delays with short sales (although the process is improving), and meanwhile the lenders have been slow to foreclose. This has created an opportunity for builders - even though there is no need for new supply in places like Las Vegas.
Yet builders here are putting up 1,100 homes, and they are frantically buying lots for even more.
Las Vegas is trying to recover by building what it does not need.
...
Some of the demand is coming from families that are getting shut out of the bidding for foreclosures by syndicates that pay in cash, and some is from investors who are back on the prowl.
Land and labor costs have fallen significantly, so the newest homes are competitively priced. Some of the boom-era homes, meanwhile, are in developments that feel like ghost towns. And many Americans will always believe the latest model of something is their only option, an attitude builders are doing their utmost to reinforce.
Click on image for larger graph in new window.This graph (from this post earlier this week) shows the negative equity and near negative equity by state. The graph is based on the data in the First American CoreLogic Q1 2010 negative equity report this week.
From the report:
The good news for buyers is there are probably many more distressed sales coming.Negative equity continues to be concentrated in five states: Nevada, which had the highest percentage negative equity with 70 percent of all of its mortgaged properties underwater, followed by Arizona (51 percent), Florida (48 percent), Michigan (39 percent) and California (34 percent). Las Vegas remains the top ranked CBSA with 75% of mortgaged properties being underwater, followed by Stockton (65%), Modesto (62%), Vallejo-Fairfield (60%) and Phoenix (58%).
ECB's Trichet: "Most difficult situation" since World War
by Calculated Risk on 5/15/2010 11:30:00 AM
From an intereview in Der Spiegel with European Central Bank President Jean-Claude Trichet: A 'Quantum Leap' in Governance of the Euro Zone Is Needed. A few excerpts:
Trichet: "[I]t is clear that since September 2008 we have been facing the most difficult situation since the Second World War -- perhaps even since the First World War. We have experienced -- and are experiencing -- truly dramatic times."On buying government bonds of EU countries:
Trichet: Our measures are explicitly authorized by the (EU) treaty. We are not embarking on quantitative easing. We are helping some market segments to function more normally. And, as I said, we will take back all the additional liquidity that we will supply in our Securities Markets Program.On countries leaving the euro:
SPIEGEL: Would it not be good if a country such as Greece were able to leave the euro area?
Trichet: No. This is excluded. If a country joins the euro area, it shares a common destiny with the other members. There is a need for a quantum leap in the governance of the euro area. There need to be major improvements to prevent bad behavior, to ensure effective implementation of the recommendations made by "peers" and to ensure real and effective sanctions in case of breaches (of the Stability and Growth Pact).


