 RSS Feed
 by Calculated Risk on 5/07/2010 12:51:00 PM
Friday, May 07, 2010
Temporary Help and Diffusion Index
Here are a couple more graphs based on data in the employment report ...
Temporary Help
From the BLS report:
Temporary help services continued to add jobs (26,000); employment in this industry has increased by 330,000 since September 2009.
 This graph is a little complicated. The red line is the three month average change in temporary help services (left axis). This is shifted four months into the future.
The blue line (right axis) is the three month average change in total employment (excluding temporary help services).
Unfortunately the data on temporary help services only goes back to 1990, but it does appear that temporary help leads employment by about four months.
The thinking is that before companies hire permanent employees following a recession, employers will first increase the hours worked of current employees (hours worked increased slightly in April) and also hire temporary employees. Since the number of temporary workers increased sharply over the last seven months, some people think this might be signaling the beginning of a strong employment recovery.
However, there has been some evidence of a shift by employers to more temporary workers, and the saying may become "We are all temporary now!", so use this increase with caution.
Note that the temporary hiring for the Census is excluded from this graph.
Diffusion Index
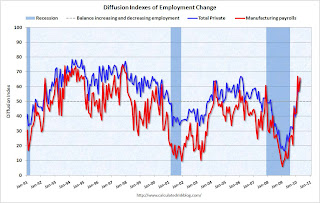 The BLS diffusion index for total private employment increased to 64.3 from 57.8 in March. This is the highest level since 2006. For manufacturing, the diffusion index is at 65.9; the highest since 1998.
Think of this as a measure of how widespread job gains are across industries. The further from 50 (above or below), the more widespread the job losses or gains reported by the BLS. From the BLS:
Figures are the percent of industries with employment increasing plus one-half of the industries with unchanged employment, where 50 percent indicates an equal balance between industries with increasing and decreasing employment.This fits with the headline payroll report and is a positive.
Earlier employment posts today:
Employment-Population Ratio, Part Time Workers, Unemployed over 26 Weeks
by Calculated Risk on 5/07/2010 09:59:00 AM
Here are a few more graphs based on the employment report ...
Employment-Population Ratio
The Employment-Population ratio increased to 58.8% in April (from 58.6% in March), after plunging since the start of the recession. This is about the same level as in December 1983. Click on graph for larger image in new window.
This graph shows the employment-population ratio; this is the ratio of employed Americans to the adult population.
Note: the graph doesn't start at zero to better show the change.
The general upward trend from the early '60s was mostly due to women entering the workforce.
The Labor Force Participation Rate increased to 65.2% from 64.9% in March. This is the percentage of the working age population in the labor force. This is still well below the 66% to 67% rate that was normal over the last 20 years. As people return to the labor force, as the employment picture improves, this will put upward pressure on the unemployment rate - even with job growth.
Part Time for Economic Reasons  From the BLS report:
The number of persons employed part time for economic reasons (sometimes referred to as involuntary part-time workers) was about unchanged at 9.2 million in April. These individuals were working part time because their hours had been cut back or because they were unable to find a full-time job.The number of workers only able to find part time jobs (or have had their hours cut for economic reasons) was at 9.152 million in April.
The all time record of 9.24 million was set in October.
These workers are included in the alternate measure of labor underutilization (U-6) that was at 17.1% in April.
Unemployed over 26 Weeks
 The blue line is the number of workers unemployed for 27 weeks or more. The red line is the same data as a percent of the civilian workforce.
According to the BLS, there are a record 6.72 million workers who have been unemployed for more than 26 weeks (and still want a job). This is a record 4.34% of the civilian workforce. (note: records started in 1948)
Although the headline number of 290,000 payroll jobs was a positive (this is 224,000 after adjusting for the 66,000 Census 2010 temporary hires), the underlying details were mixed. The positives: the employment-population ratio increased (after plunging sharply), and average hours increased.
Negatives include the unemployment rate increasing to 9.9%, a near record number of part time workers (for economic reasons) pushing U-6 to 17.1%, and a record number of workers unemployed for more than 26 weeks.
The number of long term unemployed is one of the key stories of this recession, especially since many of them are now losing their unemployment benefits. Note: In Q1, all of the increase in income - and much of the increase in consumption - came from government transfer payments for unemployment benefits.
I'll have even more later ...
Earlier employment post today:
April Employment Report: 290K Jobs Added, 9.9% Unemployment Rate
by Calculated Risk on 5/07/2010 08:30:00 AM
From the BLS:
Nonfarm payroll employment rose by 290,000 in April, the unemployment rate edged up to 9.9 percent, and the labor force increased sharply, the U.S. Bureau of Labor Statistics reported today.
 Click on graph for larger image.
This graph shows the unemployment rate and the year over year change in employment vs. recessions.
Nonfarm payrolls increased by 290,000 in April. The economy has lost 1.4 million jobs over the last year, and 7.8 million jobs since the recession started in December 2007.
The unemployment rate increased to 9.9 percent as people returned to the workforce.
 The second graph shows the job losses from the start of the employment recession, in percentage terms (as opposed to the number of jobs lost).
For the current recession, employment peaked in December 2007, and this recession is by far the worst recession since WWII in percentage terms, and 2nd worst in terms of the unemployment rate (only early '80s recession with a peak of 10.8 percent was worse).
Census 2010 hiring was 66,000 (NSA) in April.
This was well above expectations, especially given the level of Census 2010 hiring. The increase in the unemployment rate was because of people returning to the work force - the decline in the participation rate during the recession was stunning, and it is no surprise that people are once again looking for work. I'll have much more soon ...
Thursday, May 06, 2010
Employment Report Preview
by Calculated Risk on 5/06/2010 11:59:00 PM
The BLS will release the April Employment situation report tomorrow (Friday) morning at 8:30 AM ET. The consensus is around 200K payroll jobs and the unemployment rate declining slightly to 9.6%.
The estimates for temporary Census 2010 hiring are around 100K, so the market expectation is for about 100K payroll jobs ex-Census. That is the key number (the underlying job creation). Note: the largest increase in Census 2010 hiring will happen in May - perhaps 500K payroll jobs - and then all of those jobs will be unwound over the next 6 months.
The earlier data this week has been somewhat mixed. ADP reported 32K private sector jobs in April, the largest monthly increase since January 2008.
The ISM manufacturing report suggested fairly robust hiring in the manufacturing sector:
ISM's Employment Index registered 58.5 percent in April, which is 3.4 percentage points higher than the 55.1 percent reported in March. This is the fifth consecutive month of growth in manufacturing employment.Of course the manufacturing sector is relatively small.
And the ISM non-manufacturing report suggested job losses in the much larger service sector:
Employment activity in the non-manufacturing sector contracted in April for the 28th consecutive month. ISM's Non-Manufacturing Employment Index for April registered 49.5 percent. This reflects a decrease of 0.3 percentage point when compared to the 49.8 percent registered in March.The weekly initial unemployment claims was elevated throughout April suggesting continuing weakness in employment, but the Monster employment index was strong.
The Monster Employment Index rose eight points in April as a number of industries initiated springtime recruitment efforts. The annual growth rate further accelerated, rising by 11 percent, the highest rate of increase since July 2007.Anything above 100K ex-Census will be viewed as a solid report. As far as the unemployment rate, it usually drops 0.1% to 0.2% during the peak of the Census hiring (April and May) - however the participation rate fell so far during the recession, it is possible that the unemployment rate will tick up as more people reenter the workforce. We will know in a few hours ...
Market Selloff: Looking for clues
by Calculated Risk on 5/06/2010 09:20:00 PM
From Graham Bowley at the NY Times: Markets Plunge, Then Stage a Rebound
[I]n Washington a team of Treasury officials began combing through market tapes trying to figure out what was going on. By the evening they still had not gotten to the bottom of it, but they discovered some aberrations — market blips — in trading coming out of Chicago.And from Scott Patterson at the WSJ: Did Shutdowns Make Plunge Worse?
...
As of about 6 p.m., all the officials knew was that there had been what one official called “a huge, anomalous, unexplained surge in selling, it looks like in Chicago, at about 2:45.” The source remained unknown, but it had apparently set off algorithmic trading strategies, which in turn rippled across everything, pushing trading out of whack and feeding on itself — until it started to reverse.
Federal officials fielded rumors ... But they did not know the truth.
What happens to the day’s market losers will depend on what the cause was and whether it can be identified. That is a question for the S.E.C.
A number of high-frequency firms stopped trading Thursday in the midst of the market plunge, possibly adding to the market's unprecedented selloff.No answers yet - just rumors.
Tradebot Systems Inc., a large high-frequency firm based in Kansas City, Mo., closed down its computer trading systems when the Dow Jones Industrial Average had dropped about 500 points ... Tradeworx Inc., a N.J. firm that operates a high-frequency fund, also stopped trading during the market turmoil ...


