 RSS Feed
 by Calculated Risk on 5/03/2010 08:12:00 PM
Monday, May 03, 2010
More Fed Bubble Talk in 2004
There has been widespread discussion of the March 2004 Fed comments and chart I posted on Saturday. To review: in March 2004, Fed associate research director Stephen Oliner presented a chart of rents-to-house prices and commented that "even after you account for the fundamentals, there’s a part of the increase [in house prices] that is hard to explain".
This should have set off alarms. Is there widespread speculation? Are lending standards too loose?
Here are some comments from Minneapolis Fed President Gary Stern at the November 10, 2004 FOMC meeting that answers those questions:
Stern: A little over a week ago, we hosted at the Bank a meeting on housing and residential construction activity. There were several reasons for this. One, of course, was the fact that we hear periodic discussions of a potential bubble in house prices. But second, I’ve been struck, as I’ve watched developments in the Twin Cities and as I’ve traveled around other cities in the last several years, by the absolutely high level of construction activity that seems to be occurring. It’s not only new building, but conversions of all sorts of warehouses, schools, and former office buildings to residential property. A change in mix seems to be occurring as well, with more of the construction and renovation yielding townhouses and condominiums rather than the standard single-family home.Loose lending standards, widespread speculation, conversion of all kinds of buildings to residential - and this in flat land!
...
Let me just note three specific issues that came up because I, at least, found them of interest. The first, which it won’t surprise this group to hear, is that they attributed a good deal of the strength in housing to very favorable financial conditions. In this regard they talked not only about low interest rates but also lower down-payment requirements. I might add that a couple of the lenders did say that they thought the credit pendulum had swung too far. They felt that credit conditions had become too easy, and they were anticipating some potential difficulties going forward—presumably in somebody else’s shop! [Laughter] Second, they reported that at least in some markets a significant percentage of the purchases of new units were by investors, where the term “investors” means people who don’t intend to occupy the property, at least not immediately. As best they could judge, in some markets investors were buying up to 30 percent of the new additions to supply. And finally, they noted that there seemed to be some acceleration of purchases by first-time homebuyers who were concerned that they were going to be priced out of the market if they waited longer. The implications of that, of course, are that at some point such sales will slow because people will have acted if they could.
CHAIRMAN GREENSPAN. Shall we take a coffee break and return in fifteen minutes, please.
So in March 2004 a Fed researcher was expressing concern about house prices being out of line with fundamentals, and in November 2004 a Fed President is talking about widespread speculation ... and then there was no further discussion. The 2005 transcripts will be very interesting (to be released next year).
For more see:
Fed: Banks Keep Lending Standards Unchanged, Loan Demand Weakens Further
by Calculated Risk on 5/03/2010 06:04:00 PM
From the Fed: The April 2010 Senior Loan Officer Opinion Survey on Bank Lending Practices
The April survey indicated that most banks kept their lending standards unchanged in the first quarter, but that moderate net fractions of banks further tightened many terms on loans to businesses and households. ... The survey also indicated that loan demand generally weakened further.In general banks have stopped tightening lending standards, however demand continues to weaken. For commercial real estate, the banks are still tightening standards:
emphasis added
A significant number of domestic banks, on balance, continued to report having tightened standards on CRE loans. However, this net fraction was considerably smaller than in the January survey. As in the previous survey, domestic banks reported weaker demand for CRE loans, on net.And on a special question regarding the the use of CRE loan extensions:
In response to a special question, sizable fractions of both domestic and foreign respondents reported having increased their use of CRE loan extensions over the previous six months.This is similar to the last survey in January ... generally banks have ceased tightening lending standards (this is probably as tight as it gets for this cycle), but loan demand weakened further.
U.S. Light Vehicle Sales 11.2 Million SAAR in April
by Calculated Risk on 5/03/2010 03:28:00 PM
Based on an estimate from Autodata Corp, light vehicle sales were at a 11.21 million SAAR in April. This is up 21.8% from April 2009 (when sales were at the lowest level in 30 years), and down 4.6% from the March sales rate that was driven by incentives. Click on graph for larger image in new window.
This graph shows the historical light vehicle sales (seasonally adjusted annual rate) from the BEA (blue) and an estimate for April (red, light vehicle sales of 11.21 million SAAR from Autodata Corp). The second graph shows light vehicle sales since the BEA started keeping data in 1967.
Auto sales have recovered from the low levels of early 2009, but are still below the lowest point of the '90/'91 recession (even with a larger number of registered drivers).
This was slightly below most forecasts of around 11.5 million SAAR.
Q1: Office, Mall and Lodging Investment
by Calculated Risk on 5/03/2010 01:30:00 PM
Here are graphs of office, mall and lodging investment through Q1 2010 based on the underlying detail data released by the BEA today ...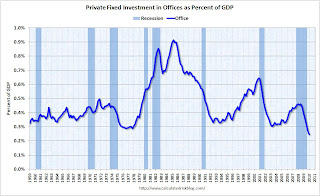 Click on graph for larger image in new window.
This graph shows investment in offices as a percent of GDP. Office investment as a percent of GDP peaked at 0.46% in Q3 2008 and has declined sharply to a new all time low (as a percent of GDP).
Reis reported that the office vacancy rate rose to the highest level since the early '90s in Q1 2010 at 17.2%, up from 17.0% in Q4 and 15.2% in Q1 2009. The peak vacancy rate following the 2001 recession was 16.9%. With the office vacancy rate still rising, office investment will probably decline further - although most of the decline in investment has already happened.
Office investment is usually the most overbuilt in a boom, but this time the office market struggled for a few years after the stock market bubble burst and there was comparatively more investment in malls and hotels. The second graph is for investment in malls.
Investment in multimerchandise shopping structures (malls) peaked in 2007 and has fallen by over 50% (note that investment includes remodels, so this will not fall to zero). Mall investment is also at an all time low (as a percent of GDP) and will probably continue to decline through 2010.
Reis reported that the mall vacancy rate in Q1 2010 was the highest on record at 8.9% for regional malls, and the highest since 1991 for strip malls.  The third graph is for lodging (hotels).
The recent boom in lodging investment was stunning. Lodging investment peaked at 0.32% of GDP in Q2 2008 and has fallen by almost 2/3rds already..
I expect lodging investment to continue to decline through at least 2010.
As projects are completed there will be little new investment in these categories for some time. Notice that investment in all three categories typically falls for a year or two after the end of a recession, and then usually recovers very slowly. Something similar will probably happen again, and there will not be a recovery in these categories until the vacancy rates fall significantly.
General Motors: Sales up 6.4% compared to April 2009
by Calculated Risk on 5/03/2010 11:09:00 AM
From MarketWatch: GM April U.S. sales up 6.4% to 183,997 vehicles and from GM: Chevrolet-Buick-GMC-Cadillac Sales Increase 20 Percent in April
Note: GM discontinued several brands, so total vehicle sales were up 6.4%.
Update: From MarketWatch: Ford U.S. April sales jump 24.7% to 167,542 units
Update2: from MarketWatch: Chrysler U.S. April sales increase 25%
Update3: from MarketWatch: Toyota U.S. April sales up 24.4% to 157,439 units
This is based on a very easy comparison: in April 2009 U.S. light vehicle sales fell 36% to 9.2 million (SAAR) from 14.4 million (SAAR) in April 2008. The sharp decline last year was due to the financial crisis, the recession, and reports of the then impending bankruptcy of GM and Chrysler (Chrysler filed for bankruptcy at the end of April, 2009, GM filed for bankruptcy on June 1, 2009).
I'll add reports from the other major auto companies as updates to this post.
NOTE: Once all the reports are released, I'll post a graph of the estimated total April sales (SAAR: seasonally adjusted annual rate) - usually around 4 PM ET. Most estimates are for a slight decrease from the 11.75 million SAAR in March.


