 RSS Feed
 by Calculated Risk on 5/01/2010 08:53:00 PM
Saturday, May 01, 2010
Fed Discussed Possible Housing Bubble in 2004
The Fed released the transcripts for the 2004 FOMC meeting this week. There definitely was some mention of a possible housing bubble, but little discussion.
From June 30, 2004: 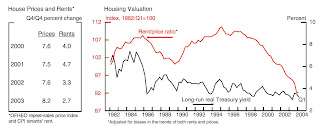 Click on graph for larger image in new window.
This graph shows the Fed estimate of the rent-to-price ratio in June 2004. Usually this is drawn inverted (Price-to-rent). And this was after the Fed made some technical adjustments - otherwise, in the words of a Fed researcher, the graph would "have looked more alarming".
MR. FERGUSON [Roger Ferguson, Fed Vice Chairman in 2004]: The other question I have deals with chart 3, on housing prices. My question is about the footnote, which says that the rent–price ratio is adjusted for biases in the trends of both rents and prices. Is that where you pick up demographics and lifecycle factors? What are these biases in the trends, and how does one think about changing demographics and the relative attractiveness of owning a home versus renting? Give me some sense of whether or not the shape of the curve that you show here is likely to reverse, as you imply, or likely to stay relatively low.
MR. OLINER [Stephen Oliner, Fed associate research director]: The biases referred to in that footnote were really technical biases in the construction of the two measures shown here, the rent measure and the price measure. Had we not adjusted for them, the rent-to-price ratio would have been much lower at the end point. So it would have looked more alarming. In part we think the published data have some technical problems that need to be taken care of before this analysis can be done in a way that is meaningful. With regard to the question of owning versus renting, it depends to some extent on what is happening to interest rates because that changes that calculation at the margin. So it’s really important to plot any kind of valuation measure relative to an opportunity cost. Just showing the rent-to-price ratio I think would have been somewhat misleading; it’s really that gap that we think is the meaningful measure of valuation. And it looks somewhat rich, taking account of the fact that interest rates are relatively low and income growth has been relatively strong. I don’t want to leave the impression that we think there’s a huge housing bubble. We believe a lot of the rise in house prices is rooted in fundamentals. But even after you account for the fundamentals, there’s a part of the increase that is hard to explain.
And a couple of comments from the March 2004 meeting:
MR. GUYNN [Atlanta Fed President]: We keep looking to our directors and other contacts for indications of imbalances and pricing pressures that they might see developing, and we’ve begun to get hints of both. A number of folks are expressing growing concern about potential overbuilding and worrisome speculation in the real estate markets, especially in Florida. Entire condo projects and upscale residential lots are being pre-sold before any construction, with buyers freely admitting that they have no intention of occupying the units or building on the land but rather are counting on “flipping” the properties—selling them quickly at higher prices.
...
MR. KOHN [Fed Governor]: House prices are elevated relative to rents—and will look even more so when rates begin to rise—but are more likely to correct by rising less rapidly than by crashing. Eggs will get broken when rates begin to rise, but the capital in most intermediaries is high, and the system is resilient.
CR: Rampant speculation, an "alarming" price-to-rent chart, prices rising faster than explained by fundamentals, "eggs will be broken" - and this was in 2004. And Kohn was wrong - the system wasn't "resilient".


