 RSS Feed
 by Calculated Risk on 4/27/2010 01:24:00 PM
Tuesday, April 27, 2010
Real House Prices and the Unemployment Rate
Earlier today S&P released the Case-Shiller house price indexes for February, see: Case-Shiller House Prices "mixed" in February
Below is a comparison of real house prices and the unemployment rate using the First American Corelogic LoanPerformance national house price index (starts in 1976) and Case-Shiller Composite 10 index (starts in 1987). Both indexes are adjusted by CPI less shelter. This is an update to a post from almost a year ago. 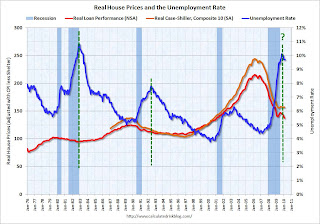 Click on image for larger graph in new window.
The two previous national declines in real house prices are evident on the graph (early '80s and early '90s). The dashed green lines are drawn at the peak of the unemployment rate following the peak in house prices.
The unemployment rate peak in 2009 is likely, but not certain.
In the early '80s, real house prices declined until the unemployment rate peaked, and then increased sluggishly for a few years. Following the late 1980s housing bubble, real house prices declined for several years after the unemployment rate peaked.
Although there are periods when there is no relationship between the unemployment rate and house prices - like during the bursting of the stock market bubble - this graph suggested to me that house prices would not bottom in real terms until the unemployment rate had peaked - and probably later (the recent housing bubble dwarfed the previous housing bubbles, and the bust will probably take some time).
Real prices, as measure by LoanPerformance, hit new lows in February, although real Case-Shiller prices are still fractionally above the lows of last year. I expect further declines in both indexes later this year, and this graph suggests that real house prices are probably still 10% or more too high on a national basis.
Real prices can decline because of falling nominal house prices (likely in my view) or from inflation (or a combination of both).
Note: earlier I mentioned that S&P has expressed concern about the Case-Shiller seasonal adjustment - here is the announcement from S&P.
S&P Downgrades Greece and Portugal
by Calculated Risk on 4/27/2010 11:42:00 AM
From MarketWatch: S&P cuts Greece ratings to junk status
Standard & Poor's said Tuesday it cut Greece's ratings to junk status. The ratings agency lowered the long-term sovereign credit rating on Greece to BB+ from BBB+. The outlook is negative.From CNBC:
S&P downgraded its rating on Portugal's debt by two notches to A-minus.
Video: Goldman's Blankfein Testifies to Congress
by Calculated Risk on 4/27/2010 09:55:00 AM
Goldman executives, including Chief Executive Lloyd Blankfein, will testify before the Senate Permanent Subcommittee on Investigations at 10 AM ET. There is apparently some interest in this testimony.
Here is the CNBC feed.
Here is the C-Span3 Link
Case-Shiller House Prices "mixed" in February
by Calculated Risk on 4/27/2010 09:00:00 AM
IMPORTANT: These graphs are Seasonally Adjusted (SA). S&P has cautioned that the seasonal adjustment is probably being distorted by irregular factors. These distortions could include distressed sales and the various government programs.
S&P/Case-Shiller released the monthly Home Price Indices for February (actually a 3 month average).
The monthly data includes prices for 20 individual cities, and two composite indices (10 cities and 20 cities).
From S&P: Home Prices Mixed in February 2010
Data through February 2010, released today by Standard & Poor’s for its S&P/Case-Shiller Home Price Indices, the leading measure of U.S. home prices, show that the annual rates of decline of the 10-City and 20-City Composites improved in February compared to January 2010. For the first time since December 2006, the annual rates of change for the two Composites are positive. The 10-City Composite is up 1.4% from where it was in February 2009, and the 20-City Composite is up 0.6% versus the same time last year. However, 11 of 20 cities saw year-over-year declines.
 Click on graph for larger image in new window.
 The first graph shows the nominal not seasonally adjusted Composite 10 and Composite 20 indices (the Composite 20 was started in January 2000).
The Composite 10 index is off 30.0% from the peak, and up slightly in February (SA).
The Composite 20 index is off 29.3% from the peak, and down slightly in February (SA).
 The second graph shows the Year over year change in both indices.
The Composite 10 is up 1.4% compared to February 2009.
The Composite 20 is up 0.6% compared to February 2009.
These are the first YoY price increases since 2006.
The third graph shows the price declines from the peak for each city included in S&P/Case-Shiller indices.
 Prices decreased (SA) in 15 of the 20 Case-Shiller cities in February.
 Prices in Las Vegas are off 55.7% from the peak, and prices in Dallas only off 6.0% from the peak.
Note: Congratulations to S&P: the new release format is excellent.
Morning Greece: Contagion Concerns
by Calculated Risk on 4/27/2010 08:24:00 AM
Greek government debt yields increased again this morning (ht Mike), from Bloomberg:
 |
From Bloomberg: Portugal Suffering Greek Contagion Pressures EU Bonds
With a higher debt burden and a slower 10-year growth rate than Greece, Western Europe’s poorest country is being punished by investors as the sovereign debt crisis spreads. ... Portugal’s credit default swaps show investors rank its debt as the world’s eighth-riskiest, worse than for Lebanon and Guatemala.From Bloomberg: Greece Bond Losses to Be ‘Significant,’ Buiter Says
Greece is likely to default or inflict “significant” losses on bondholders unless it receives more generous terms on its planned aid package, according to Willem Buiter, chief economist at Citigroup Inc.


