 RSS Feed
 by Calculated Risk on 4/20/2010 11:05:00 AM
Tuesday, April 20, 2010
Philly Fed State Coincident Indicators
 Click on map for larger image.
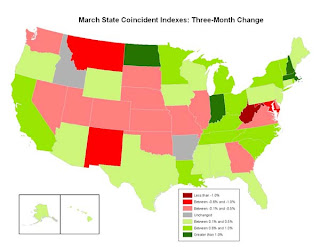
Here is a map of the three month change in the Philly Fed state coincident indicators. Seventeen states are showing declining three month activity. The index increased in 31 states, and was unchanged in 2.
Here is the Philadelphia Fed state coincident index release for March.
In the past month, the indexes increased in 35 states, decreased in 10, and remained unchanged in five (Georgia, Illinois, South Dakota, Utah, and Vermont) for a one-month diffusion index of 50. Over the past three months, the indexes increased in 31 states, decreased in 17, and remained unchanged in two (Arkansas and Idaho) for a three-month diffusion index of 28.
 The second graph is of the monthly Philly Fed data of the number of states with one month increasing activity. Based on this indicator, most of the U.S. was in recession in early 2008.
The last time the index was higher was in December 2007.
Note: this graph includes states with minor increases (the Philly Fed lists as unchanged).
DOT: Vehicle Miles Driven Decline in February
by Calculated Risk on 4/20/2010 08:52:00 AM
The Department of Transportation (DOT) reported today that vehicle miles driven in February were down from February 2009:
Travel on all roads and streets changed by -2.9%(-6.3 billion vehicle miles) for February 2010 as compared with February 2009. Travel for the month is estimated to be 212.9 billion vehicle miles.
Cumulative Travel for 2010 changed by -2.3% (-10.1 billion vehicle miles).
 Click on graph for larger image in new window.
This graph shows the percent change from the same month of the previous year as reported by the DOT.
As the DOT noted, miles driven in February 2010 were down -2.9% compared to February 2009.
 The second graph shows the moving 12 month total of miles driven (to remove seasonality).
The moving 12 month total peaked in November 2007. The impact on vehicle miles of the gasoline shortages in the '70s are clear - in the late '70s and early '80s, it took 40 months before vehicle miles returned to the peak of April 1979.
Blame it on the snow - except this is the 2nd month in a row with a year-over-year decline in miles driven. If vehicle miles continues to decline on a year-over-year basis, it might suggest high gasoline prices are starting to impact the economy.
Monday, April 19, 2010
Greece: Bond spreads widen as Bundesbank President says Greece may need more aid
by Calculated Risk on 4/19/2010 07:21:00 PM
An update on Greece: The IMF team was delayed arriving in Greece because of the ash from the Iceland volcano, meanwhile the Bundesbank president was quoted as saying Greece may need more aid.
Also the German Finance Minister was quoted in Der Spiegel: "We cannot allow the bankruptcy of a euro member state like Greece to turn into a second Lehman Brothers."
From the NY Times: Greek Debt Unsettles Bond Market
Yields on Greek bonds pushed to fresh highs on Monday ... as investors continued to worry about the country’s near-term ability to finance its debt. ... The yield on benchmark 10-year Greek government bonds closed in Europe at 7.63 percent — the highest since Greece joined the euro. That widened the spread, or difference, with equivalent German bonds to 4.55 percentage points.From Bloomberg: Weber Said to Tell German Lawmakers Greece May Need More Aid
Bundesbank President Axel Weber told German lawmakers that Greece may need more aid than the 30 billion euros ($40 billion) promised by the European Union as the government in Athens struggles to push through planned spending cuts, two people present at the briefing said.An interview with German Finance Minister Wolfgang Schäuble in Der Speigel: 'We Cannot Allow Greece to Turn into a Second Lehman Brothers'
Schäuble: [W]e have experienced a financial crisis from which we in Europe must draw a clear lesson: We cannot allow the bankruptcy of a euro member state like Greece to turn into a second Lehman Brothers.
SPIEGEL: You are exaggerating. In past years, it's happened again and again that a country couldn't pay its debts, and yet that hasn't led to a collapse of the global financial system. Why should this be different in Greece's case?
Schäuble: Because Greece is a member of the European monetary union. Greece's debts are all denominated in euros, but it isn't clear who holds how much of those debts. For that reason, the consequences of a national bankruptcy would be incalculable. Greece is just as systemically important as a major bank.
Fannie Mae updates "Waiting Period" following Pre-Foreclosure Events
by Calculated Risk on 4/19/2010 03:27:00 PM
From Austin Kilgore at HousingWire: Fannie Shortens Wait for Some Distressed Borrowers to Get New Loans
Fannie Mae announced it is reducing the wait time for some borrowers between when they complete a short sale or deed-in-lieu of foreclosure transaction and when they can obtain a new mortgage.Here is the update from Fannie Mae. For other loans (mostly higher risk loans), the period has been increased to seven years (per the eligibility matrix).
Previously, a borrower was required to wait four years before getting a new mortgage, or two years if their home sold in a short sale. Under the new guidelines, a borrower that previously completed a deed-in-lieu of foreclosure transaction can get a new mortgage in two years, provided the borrower has a 20% down payment.
If the borrower has a 10% down payment, the wait period is still four years.
A couple notes: Several reports are mentioning the shorter waiting period (2 years instead of 4 years), but that is just for borrowers who put 20% down. This update also makes the policy consistent for short sales and deed-in-lieu of foreclosure transactions - and for the first time explicitly mentions short sales (since these are becoming much more common).
Moody's: CRE Prices Decline 2.6% in February
by Calculated Risk on 4/19/2010 11:43:00 AM
Moody's reported this morning that the Moody’s/REAL All Property Type Aggregate Index declined 2.6% in February. This is a repeat sales measure of commercial real estate prices.
Moody's noted that the share of distressed sales has increased sharply. In 2008 distressed sales were only 4% of all sales, in 2009 nearly 20% of all the repeat sales transaction were classified as distressed. In February 2010, the percent of distressed sales jumped to a record 32%.
Below is a comparison of the Moodys/REAL Commercial Property Price Index (CPPI) and the Case-Shiller composite 20 index.
Notes: Beware of the "Real" in the title - this index is not inflation adjusted. Moody's CRE price index is a repeat sales index like Case-Shiller - but there are far fewer commercial sales - and that can impact prices. Click on graph for larger image in new window.
CRE prices only go back to December 2000.
The Case-Shiller Composite 20 residential index is in blue (with Dec 2000 set to 1.0 to line up the indexes).
Commercial real estate values are now down 25.8% over the last year, and down 41.8% from the peak in August 2007.


