 RSS Feed
 by Calculated Risk on 4/14/2010 05:45:00 PM
Wednesday, April 14, 2010
HAMP March Data
From Treasury: Administration Releases March Loan Modification Report
 |
About 228,000 modifications are now "permanent", and 155,000 trial modification cancelled. There is still a huge number of borrowers in limbo. If we add the 228,000 permanent mods, plus 155,000 cancelled, and the 108,000 pending permanent mods that is only 491,000 borrowers - there were 825,000 borrowers in the program as of last November. So there are another 334,000 borrowers in modification limbo.
Here is the report. See here for a list of reports.
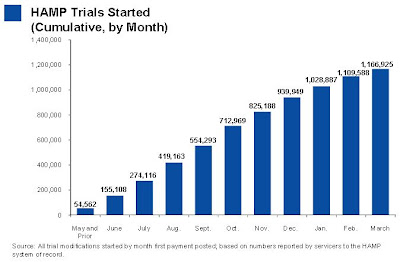 |
The second graph shows the cumulative HAMP trial programs started.
Notice that the pace of new trial modifications has slowed sharply from over 150,000 in September to around 57,000 in March 2010. This is slowest pace since May 2009 and is probably because of two factors: 1) servicers are now pre-qualifying borrowers, and 2) servicers are running out of eligible borrowers.
Debt-to-income ratios worsen
If we look at the HAMP program stats (see page 6), the median front end DTI (debt to income) before modification was 44.8% - down slightly from 45% last month. And the back end DTI was an astounding 77.5% (up from 76.4% last month).
Just imagine the characteristics of the borrowers who can't be converted!
No wonder the re-default rate is high ... from David Streitfeld at the NY Times: Defaults Rise in Loan Modification Program
The number of homeowners who secured cheaper mortgages through the government’s modification program only to default again nearly doubled in March, continuing a worrisome trend that threatens to undermine the entire program.In summary: 1) the program is slowing, 2) the borrowers DTI characteristics are poor - and getting worse, and 3) the re-default rate is rising. Oh, and 4) there are a large number of borrowers in modification limbo.
Treasury Department data released Wednesday showed that 2,879 loans that were permanently modified have defaulted since the program’s inception in the fall, up from 1,499 in February and 1,005 in January.
Rail Traffic increases in March
by Calculated Risk on 4/14/2010 03:28:00 PM
From the Association of American Railroads: Rail Time Indicators. The AAR reports traffic in March 2010 was up 7.5% compared to March 2009 - the first year-over-year increase since July 2008 - although traffic was still 11.5% lower than in March 2008.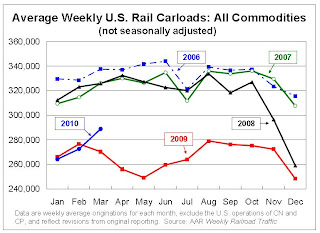 Click on graph for larger image in new window.
This graph shows U.S. average weekly rail carloads. Traffic increased in 16 of the 19 major commodity categories YoY.
From AAR:
• On a non-seasonally adjusted basis, U.S. freight railroads originated 1,443,967 carloads in March 2010, up 7.5% (100,624 carloads) from March2009 and the first year-over-year increase since July 2008(see chart)The graph above shows that rail traffic collapsed in November 2008, and now nine months into the recovery, traffic hasn't even recovered half way. This is clearly not a "V-shaped" recovery - this is far more moderate and sluggish (although the pickup in March traffic was sharp).
• On a seasonally adjusted basis, U.S. carloads in March 2010 were up 3.9% from February 2010.
• Note, though, that carloads in March 2010 were still 11.5% lower than they were in March 2008, and in all 19 commodity categories carloads were lower in March 2010 than they were in March 2008. Railroads need many more monthly increases to get back to where they were prior to the downturn.
excerpts with permission
 The second graph from the AAR report shows lumber rail traffic compared to U.S. housing starts.
From the AAR:
Seasonally-adjusted housing starts fell 5.9% in February 2010 to an annualized 575,000 from a revised 611,000 in January 2010. February 2010’s housing starts were almost the same as they were in February 2009. The bottom line is that the housing recession that’s now more than four years old shows no sign of ending.Residential investment is moving sideways with no recovery in sight.
Fed's Beige Book: Economic activity increased "somewhat"
by Calculated Risk on 4/14/2010 01:59:00 PM
From the Federal Reserve: Beige book
Overall economic activity increased somewhat since the last report across all Federal Reserve Districts except St. Louis, which reported "softened" economic conditions. Districts generally reported increases in retail sales and vehicle sales.On Real Estate:
Residential real estate activity increased, albeit from low levels, in most Districts, with the exceptions of St. Louis, where it was mixed, and San Francisco, where it was flat. Contacts in Philadelphia, Cleveland and Kansas City expressed concern about whether sales would continue to grow after the expiration of the first-time home buyer tax credit. New York, Kansas City, Dallas and San Francisco noted sluggish sales for high-end homes. Home prices were stable across most Districts, but decreased in parts of the New York and Atlanta Districts. Residential construction activity increased slightly in New York, Atlanta, St. Louis, Minneapolis and Dallas, but remained weak in Cleveland, Chicago and San Francisco.
Commercial real estate activity was slow across the nation. Notable exceptions were Richmond, which saw an uptick in commercial leasing, and Dallas, where the sector was mixed and might be nearing bottom. In Boston, leasing activity consists largely of renewals, with many renewing tenants leasing less space. Manhattan Class A office rents were down 20 percent to 25 percent year over year. Contacts in Philadelphia, Richmond, Kansas City and Dallas expressed concern that lease concessions from landlords were putting downward pressure on rents. Commercial construction continued to be weak in most Districts. Cleveland saw some development in the energy and industrial segments.
San Diego: A "Surge" in Foreclosures
by Calculated Risk on 4/14/2010 11:39:00 AM
From Eric Wolff at the North County Times: Major lender signals surge in local foreclosures
Bank of America ... ramped up its foreclosure activity in March, sending hundreds of letters warning delinquent borrowers in the region that it could sell their homes at auction in as little as three weeks ... The bank said the increased activity was a natural consequence of borrowers running out of options.This fits with what Irvine Renter reported last month on the Irvine Housing Blog.
Analysts and real estate agents said the moves ... could signal a final reckoning for homeowners who have been protected by government programs for months or even years.
...
The notices went to 230 homeowners in North San Diego County, a 69 percent increase from February, and to 391 owners in Southwest Riverside County, up 67 percent from February.
By comparison, in March 2009, ReconTrust sent a total of 31 such letters to both regions combined
...
"We have reported recently that we anticipate a rise in foreclosure activity through the coming months as homeowners are unable to qualify for loan modifications, fall out of modification programs or go into delinquency due to the ongoing stress in the economy," [Richard Simon, a Bank of America spokesman] said.
Retail Sales increase sharply in March
by Calculated Risk on 4/14/2010 08:44:00 AM
On a monthly basis, retail sales increased 1.6% from February to March (seasonally adjusted, after revisions), and sales were up 7.6% from March 2009 (easy comparison).  Click on graph for larger image in new window.
This graph shows retail sales since 1992. This is monthly retail sales, seasonally adjusted (total and ex-gasoline).
The red line shows retail sales ex-gasoline and shows the increase in final demand ex-gasoline has been sluggish.
Retail sales are up 8.3% from the bottom, but still off 4.4% from the peak. The second graph shows the year-over-year change in retail sales (ex-gasoline) since 1993.
Retail sales ex-gasoline increased by 5.3% on a YoY basis (7.6% for all retail sales). The year-over-year comparisons are easy now since retail sales collapsed in late 2008. Retail sales bottomed in December 2008.
Here is the Census Bureau report:
The U.S. Census Bureau announced today that advance estimates of U.S. retail and food services sales for March, adjusted for seasonal variation and holiday and trading-day differences, but not for price changes, were $363.2 billion, an increase of 1.6 percent (±0.5%) from the previous month and 7.6 percent (±0.5%) above March 2009. Total sales for the January through March 2010 period were up 5.5 percent (±0.3%) from the same period a year ago. The January to February 2010 percent change was revised from +0.3 percent (±0.5%)* to +0.5 percent (±0.3%).This is a strong retail sales report.


