 RSS Feed
 by Calculated Risk on 12/16/2009 09:49:00 AM
Wednesday, December 16, 2009
MBA: Mortgage Purchase Applications Flat, Rates Rise
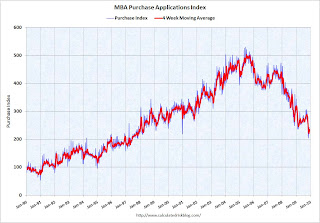
The four-week moving average of the MBA Purchase Index is near a 12 year low ...
The MBA reports: Mortgage Applications Increase in Latest MBA Weekly Survey
 Click on graph for larger image in new window.
This graph shows the MBA Purchase Index and four week moving average since 1990.
Note: In the past the MBA index was somewhat predictive of future sales - and was a favorite indicator of Alan Greenspan, but it has been questionable for some time. The increase in 2007 was due to the method used to construct the index: a combination of lender failures, and borrowers filing multiple applications pushed up the index in 2007 even though activity was actually declining. Recently there has been a substantial number of cash buyers, so the MBA index missed the strength of the recent existing home sales increase.
Although existing home sales will be very strong in November (as buyers rushed to beat the initial tax credit deadline), the indicators for residential investment have been mostly flat to weak in Q4. This includes the NAHB housing market index, housing starts, new home sales and the MBA purchase index.
Although the FOMC statement today will probably be more upbeat on the economy than in November, the statement on housing will probably have a more negative tone. Last month the FOMC said: "Activity in the housing sector has increased over recent months." That is not true now except for existing home sales that are largely irrelevant1 for residential investment and the economy.
1 Existing home sales generate some fees and commissions, but home turnover does not add to the value of the housing stock. Some people spend money on improvements and furnishings after buying a home, but this has probably been limited recently because of the types of buyers (mostly first time home buyers with minimum downpayments) and cash-flow investors. Neither group will be adding a pool or other major improvement any time soon!
The MBA reports: Mortgage Applications Increase in Latest MBA Weekly Survey
The Market Composite Index, a measure of mortgage loan application volume increased 0.3 percent on a seasonally adjusted basis from one week earlier. ...Also - most lenders are quoting mortgage rates back above 5% this week.
The Refinance Index increased 0.9 percent from the previous week and the seasonally adjusted Purchase Index decreased 0.1 percent from one week earlier.
...
The average contract interest rate for 30-year fixed-rate mortgages increased to 4.92 percent from 4.88 percent, with points decreasing to 1.08 from 1.17 (including the origination fee) for 80 percent loan-to-value (LTV) ratio loans.
 Click on graph for larger image in new window.
This graph shows the MBA Purchase Index and four week moving average since 1990.
Note: In the past the MBA index was somewhat predictive of future sales - and was a favorite indicator of Alan Greenspan, but it has been questionable for some time. The increase in 2007 was due to the method used to construct the index: a combination of lender failures, and borrowers filing multiple applications pushed up the index in 2007 even though activity was actually declining. Recently there has been a substantial number of cash buyers, so the MBA index missed the strength of the recent existing home sales increase.
Although existing home sales will be very strong in November (as buyers rushed to beat the initial tax credit deadline), the indicators for residential investment have been mostly flat to weak in Q4. This includes the NAHB housing market index, housing starts, new home sales and the MBA purchase index.
Although the FOMC statement today will probably be more upbeat on the economy than in November, the statement on housing will probably have a more negative tone. Last month the FOMC said: "Activity in the housing sector has increased over recent months." That is not true now except for existing home sales that are largely irrelevant1 for residential investment and the economy.
1 Existing home sales generate some fees and commissions, but home turnover does not add to the value of the housing stock. Some people spend money on improvements and furnishings after buying a home, but this has probably been limited recently because of the types of buyers (mostly first time home buyers with minimum downpayments) and cash-flow investors. Neither group will be adding a pool or other major improvement any time soon!
Housing Starts in November: Moving Sideways
by Calculated Risk on 12/16/2009 08:30:00 AM
 Click on graph for larger image in new window.
Total housing starts were at 574 thousand (SAAR) in November, up 8.9% from the revised October rate, and up from the all time record low in April of 479 thousand (the lowest level since the Census Bureau began tracking housing starts in 1959). Starts had rebounded to 590 thousand in June, and have moved mostly sideways for six months.
Single-family starts were at 482 thousand (SAAR) in November, up 2.1% from the revised October rate, and 35 percent above the record low in January and February (357 thousand). Just like for total starts, single-family starts have been at this level for six months.
Here is the Census Bureau report on housing Permits, Starts and Completions.
Housing Starts:This is both good news and bad news. The good news is the low level of starts means the excess housing inventory is being absorbed - a necessary step for housing (and the economy) to recover. The bad news is economic growth will probably be sluggish - and unemployment elevated - until residential investment picks up.
Privately-owned housing starts in November were at a seasonally adjusted annual rate of 574,000. This is 8.9 percent (±10.2%) above the revised October estimate of 527,000, but is 12.4 percent (±9.1%) below the November 2008 rate of 655,000.
Single-family housing starts in November were at a rate of 482,000; this is 2.1 percent (±9.2%) above the revised October figure of 472,000. The November rate for units in buildings with five units or more was 83,000.
Housing Completions:
Privately-owned housing completions in November were at a seasonally adjusted annual rate of 810,000. This is 8.7 percent (±13.7%)* above the revised October estimate of 745,000, but is 25.3 percent (±10.1%) below the November 2008 rate of 1,084,000.
Single-family housing completions in November were at a rate of 524,000; this is unchanged (±11.7%)* compared with the revised October figure. The November rate for units in buildings with five units or more was 270,000.
Tuesday, December 15, 2009
Citigroup's "Massive" Tax Break
by Calculated Risk on 12/15/2009 11:11:00 PM
The WaPo has an article about a tax break for Citigroup: U.S. gave up billions in tax money in deal for Citigroup's bailout repayment
The Internal Revenue Service on Friday issued an exception to long-standing tax rules for the benefit of Citigroup and a few other companies partially owned by the government. As a result, Citigroup will be allowed to retain billions of dollars worth of tax breaks that otherwise would decline in value when the government sells its stake to private investors.Who benefits? The value of the shares the U.S. owns should increase, but only 34% of the share price increase accrues to U.S. taxpayers The other current shareholders receive the rest. So this doesn't seem to make sense ...
While the Obama administration has said taxpayers are likely to profit from the sale of the Citigroup shares, accounting experts said the lost tax revenue could easily outstrip those profits.
...
Federal tax law lets companies reduce taxable income in a good year by the amount of losses in bad years. But the law limits the transfer of those benefits to new ownership as a way of preventing profitable companies from buying losers to avoid taxes. Under the law, the government's sale of its 34 percent stake in Citigroup, combined with the company's recent sales of stock to raise money, qualified as a change in ownership.
The IRS notice issued Friday saves Citigroup from the consequences by stipulating that the government's share sale does not count toward the definition of an ownership change.
AIA: Architecture Billings Index Shows Contraction in November
by Calculated Risk on 12/15/2009 08:10:00 PM
The American Institute of Architects’ Architecture Billings Index declined to 42.8 in November from 46.1 in October. Any reading below 50 indicates contraction.
"There continues to be a lot of uncertainty in the construction industry that likely will delay new projects in the near future," said Kermit Baker, chief economist at the American Institute of Architects. (via WSJ, press release not online yet) Click on graph for larger image in new window.
This graph shows the Architecture Billings Index since 1996. The index has remained below 50, indicating falling demand, since January 2008.
Historically there is an "approximate nine to twelve month lag time between architecture billings and construction spending" on non-residential construction. This suggests further significant declines in CRE investment through 2010, and probably longer.
Note: Nonresidential construction includes commercial and industrial facilities like hotels and office buildings, as well as schools, hospitals and other institutions.
Bernanke Responds to Senator Bunning
by Calculated Risk on 12/15/2009 05:07:00 PM
Chairman Bernanke has responded in writing to a series of question from Senator Bunning.
There are questions on Fed policy, gold, the dollar, and much more. Here are a couple of questions:
Bunning: 58. Are you concerned that the debt to GDP ratio in this country is more than 350%? Do you believe a high debt to GDP ratio is reason for tightening Fed policy? Why or why not?Two points: we see graphs all the time showing the total debt to GDP at around 350%, but that double counts financial intermediation.
Bernanke: The current ratio of public and private debt to GDP, including not only the debt of the nonfinancial sector but also the debt of the financial sector, is about 350 percent. (Many analysts prefer to focus on the debt of the nonfinancial sectors because, they argue, the debt of the financial sector involves some double-counting--for example, when a finance company funds the loans it provides to nonfinancial companies by issuing bonds. The ratio of total nonfinancial debt to GDP is about 240 percent.) Private debt has been declining as households and firms have been reducing spending and paying down pre-existing obligations. For example, households, who are trying to repair their balance sheets, reduced their outstanding debt by 1.3 percent (not at an annual rate) during the first three quarters of this year.
In contrast, public debt is growing rapidly. Putting fiscal policy on a sustainable trajectory is essential for promoting long-run economic growth and stability. Currently, the ratio of federal debt to GDP is increasing significantly, and those increases cannot continue indefinitely. The increases owe partly to cyclical and other temporary factors, but they also reflect a structural federal budget deficit. Stabilizing the debt to GDP ratio at a moderate level will require policy actions by the Congress to bring federal revenues and outlays into closer alignment in coming years.
The ratio of government debt to GDP does not have a direct bearing on the appropriate stance of monetary policy. Rather, the stance of monetary policy is appropriately set in light of the outlook for real activity and inflation and the relationship of that outlook to the Federal Reserve’s statutory objectives of maximum employment and price stability. Of course, government indebtedness may exert an indirect influence on monetary policy through its potential implications for the level of interest rates consistent with full employment and low inflation. But in that respect, fiscal policy is just one of the many factors that influence interest
rates and the economic outlook.
emphasis added
 Click on graph for larger image in new window.
The 240% number is probably a better representation of the debt burden of the United States. Here is an example from Rolfe Winkler at Reuters (source: Reuters)
On the structural deficits: I've been writing about this for years. Nothing is more concerning than a large structural deficit during periods of high employment (like earlier in this decade when Bernanke was Chairman of the CEA). I don't recall Bernanke every mentioning the structural deficit when he was on the CEA.
Senator Bunning: 5. We saw the crowding out of the private mortgage market caused by Freddie and Fannie’s overwhelming control of mortgages during 2002 to 2006 period. Do you think there is a danger to allowing an extended public-controlled mortgage market? And what steps is the Fed taking to reestablish a private mortgage market?OK, this was a trick question, but Bernanke missed it. We did NOT see the crowding out of the private mortgage market in the period mentioned - in fact the private mortgage market expanded dramatically in the 2004 through 2006 period as shown in the following graph from San Francisco Fed Senior Economist John Krainer: Recent Developments in Mortgage Finance
 This is figure 3 from the Economic Letter. This shows the surge in non-agency securitized loans, and loans held in bank portfolios, in 2004 through 2006 (the worst loans).
 [T]he sources of mortgage finance have shifted as the housing market has gone from boom to bust. Figure 3 plots the evolution of these funding sources over the past decade. Fannie Mae and Freddie Mac combined have consistently been the largest players in the market, owning or guaranteeing about half or more of the mortgages in the sample at any given time. Non-agency securitization peaked in the first quarter of 2006, when it accounted for nearly 40% of new originations.There is much more in the Q&A.


