 RSS Feed
 by Calculated Risk on 12/01/2005 03:04:00 PM
Thursday, December 01, 2005
Quarterly House Appreciation by State
In addition to YoY appreciation rates, the OFHEO HPI also presents the quarterly appreciation by state. Every state had positive price increases for Q3 2005.
The worst performing states in Q3 were Michigan (0.89% quarterly increase, 3.6% annual rate) and Kansas (0.94% quarterly increase, 3.8% annual rate).
The best was Arizona (7.3% quarterly increase or a 32.6% annual rate). The following map shows the state by state quarterly appreciation:
Quarterly Appreciation:
Red: Greater than 5%
Dark Orange: 4% to 5%
Light Orange: 3% to 4%
Purple: 2% to 3%
Light Blue: 1% to 2%
Dark Blue: less than 1%
Its important to note these are quarterly rates.
Florida, the DC area and the West Coast continue to see the most price appreciation. Massachusetts has cooled substantially as inventories have increased, although prices still appreciated 1.4% for Q3 (or 5.7% annual rate).
House Price Index Shows 12 Percent Annual Increase
by Calculated Risk on 12/01/2005 10:19:00 AM
The Office of Federal Housing Enterprise Oversight (OFHEO) released (pdf) their Q3 House Price Index this morning.
UPDATE: See Kash's Post: House Prices. Kash breaks the numbers down by some of the hotter markets.
Average U.S. home prices increased 12.02 percent year over year from the third quarter of 2004 through the third quarter of 2005. This represents a two ercentage point decline from the previous four-quarter appreciation rate of approximately 14 percent. Appreciation for the most recent quarter was 2.86 percent. The figures were released today by OFHEO Acting Director Stephen A. Blumenthal, as part of the House Price Index (HPI), a quarterly report analyzing housing price appreciation trends.
“Appreciation rates in the third quarter were extremely strong, although some deceleration can be seen in a number of the faster-appreciating markets,” said OFHEO Chief Economist Patrick Lawler. “Price momentum in the Pacific and New England states, in particular, has pulled back.”
House prices grew more rapidly over the last year than did prices of non-housing goods and services reflected in the Consumer Price Index. House prices rose 12 percent, while prices of other goods and services rose only 4.5 percent.
Appreciation rates in the Pacific Census Division fell from last quarter, but remain higher than in other areas. At slightly less than 16.9 percent, the four-quarter appreciation rate in the South Atlantic Division now trails appreciation in the Pacific by less than one-half a percentage point.
Other significant findings in the HPI:
1. Price growth in Arizona continues to accelerate, with a one-year appreciation rate of 30 percent, the largest of any state by a wide margin.
2. Florida became the second fastest-appreciating state, with four-quarter appreciation of 25 percent and 11 of the 20 highest ranked Metropolitan Statistical Areas (MSAs).
3. Nevada’s four-quarter appreciation rate declined by more than 10 percentage points from the previous rate of 28.6 to 17.6 percent.
4. Two states that continue to show noticeable house price appreciation are Idaho and Utah. Idaho, with an appreciation rate of 15.1 percent on a four-quarter basis, is now ranked 12 among states, up from 20 in the previous HPI report. With annual price growth of 11.4 percent, Utah’s ranking jumped to 22, compared with 31 in the previous HPI report and last place in the fourth quarter of 2003.
5. With a four-quarter appreciation rate of 34.4 percent, Phoenix-Mesa-Scottsdale, AZ topped the list of the fastest appreciating MSAs for the first time since OFHEO began publishing its index in the fourth quarter of 1995. Last quarter’s top MSA, Naples-Marco Island, FL, dropped to number three.
6. For the first time since the fourth quarter of 2003, the list of the Top 20 MSAs having the highest appreciation does not contain any Nevada cities. Reno-Sparks, NV, the fourth ranked market last quarter is now 29 among the 265 ranked MSAs. Also, Las Vegas - Paradise, NV has fallen from 21 to 77, with four-quarter appreciation of 13.77 percent.
“Much of the recent run-up in mortgage rates occurred after the third quarter ended,” said Lawler. “To the extent that those increases may have affected prices, those effects will be evident in future quarters.”
Changes in the mix of data from refinancings and house purchase transactions can affect HPI results. This HPI report includes an index that is calculated using only purchase price data. The index shows an increase of 10.95 percent for the U.S. between the third quarter of 2004 and the third quarter of 2005.
Wednesday, November 30, 2005
The Indefatigable Consumer
by Calculated Risk on 11/30/2005 08:14:00 PM
Should the American consumer be labeled 'indefatigable' or 'incorrigible'? One thing is certain, the consumer crossed the savings Rubicon in the summer of 2005.
First, a warm welcome back to General Glut: How we achieved 4.3%!
As Gen'l Glut points out, personal saving as a percentage of disposable personal income reached -1.5% in Q3 2005. So imagine the line on Dr. Hamilton's graph continuing its descent into negative territory.
The Rubicon has been crossed.
MBA: Refinance Applications Down Again
by Calculated Risk on 11/30/2005 11:14:00 AM
The Mortgage Bankers Association (MBA) reports: Mortgage Application Volume Dips During Holiday Shortened Week
The Market Composite Index — a measure of mortgage loan application volume – was 624.1 a decrease of 1.8 percent on a seasonally adjusted basis from 635.4, one week earlier. On an unadjusted basis, the Index decreased 33.2 percent compared with the previous week but was down 8.0 percent compared with the same week one year earlier. The seasonally-adjusted indexes include an additional adjustment to account for the Thanksgiving holiday.
The seasonally-adjusted Purchase Index increased by 0.8 percent to 476.2 from 472.3 the previous week whereas the Refinance Index decreased by 6.3 percent to 1484.3 from 1584.1 one week earlier.

Click on graph for larger image.
The graph shows overall and purchase activity since June. Overall activity has fallen significantly due to the drop in refis. Purchase activity is steady.
As expected, mortgage rates declined again last week:
The average contract interest rate for 30-year fixed-rate mortgages decreased to 6.20 percent from 6.26 percent on week earlier...Mortgage rates will probably increase this week. Overall this report shows purchase activity is steady at a very high level, but refinance activity continues to decline significantly. It is possible that MEW (Mortgage Equity Withdrawal) is falling rapidly, and this would be expected to impact consumer spending - maybe early next year.
The average contract interest rate for 15-year fixed-rate mortgages decreased to 5.72 percent from 5.83 percent...
See: Real-Estate Boom Soon May Sputter As an Engine of Retail Sales
Tuesday, November 29, 2005
Record October New Home Sales: 1.424 Million
by Calculated Risk on 11/29/2005 10:10:00 AM
According to the Census Bureau report, New Home Sales in October were at a seasonally adjusted annual rate of 1.424 million vs. market expectations of 1.20 million. September sales were revised up to 1.260 million from 1.222 million.
Click on Graph for larger image.
NOTE: The graph starts at 700 thousand units per month to better show monthly variation.
Sales of new one-family houses in October 2005 were at a seasonally adjusted annual rate of 1,424,000, according to estimates released jointly today by the U.S. Census Bureau and the Department of Housing and Urban Development.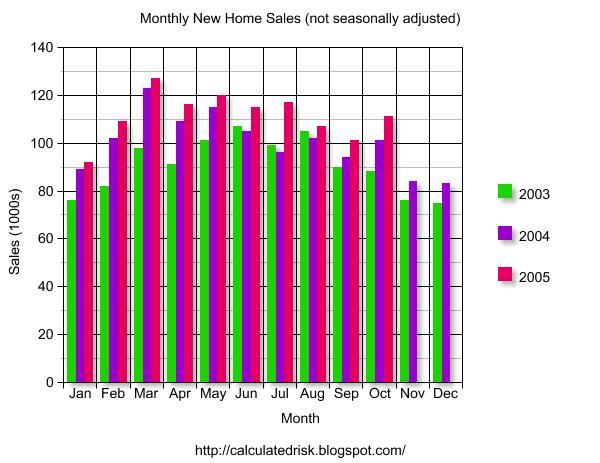
The Not Seasonally Adjusted monthly rate was 111,000 New Homes sold, up from a revised 101,000 in September.
On a year over year basis, October 2005 sales were 10% higher than October 2004.
The median sales price was stable and previous months were revised upwards.
The median sales price of new houses sold in October 2005 was $231,300; the average sales price was $286,500.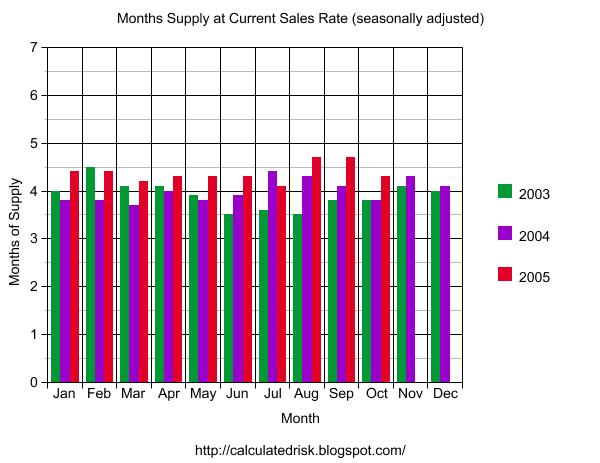
The seasonally adjusted estimate of new houses for sale at the end of October was 496,000. This represents a supply of 4.3 months at the current sales rate.
The 496,000 units of inventory is the all time record for new houses for sale. On a months of supply basis, inventory is at a reasonable level.
This is a very strong report. The pronouncements of the demise of the housing market now appear premature.


