 RSS Feed
 by Calculated Risk on 10/28/2005 08:48:00 PM
Friday, October 28, 2005
UCLA's Dr. Thornberg: California Housing 35% overvalued
The Economic Alliance for Business (EDAB) just released their October 2005 East Bay Quarterly Forecast, authored by Christopher Thornberg, Senior Economist for UCLA Anderson Forecast (thanks to Robert Sakai). The report is fairly positive on the economy over the next few quarters, but is cautionary on real estate. Dr. Thornberg writes:
The good news is likely to continue for the next few quarters. Katrina and Rita may have monopolized the newspapers, but they will have little impact positive or negative on the California economy. Gas prices are already on their way back down. Demand is softening as the year moves into the winter season and refining capacity is coming back online. With pockets flush again, expect a solid holiday season for retailers in the area.From the section on Real Estate: Is the party coming to an end?
But there are storm clouds on the horizon that are being generated by yet another low-pressure system building up -- our housing markets. Prices have continued their truly meteoric rise, as has the pace of building. But there are signs the market is starting to lose its oomph. Market activity in the Bay Area has started to slow sharply, and inventories are on the rise.
As has been discussed in this and past reports, the primary driver of the California economy, including the Bay Area and the East Bay, has been the residential real estate boom. ... All this new construction has been creating many of the new jobs in the state including those in finance companies working to extend credit. And while we lack direct evidence, it appears that consumer spending is being fueled largely by the wealth being generated within the economy by the massive rate of appreciation.After a discussion of housing fundamentals, Thornberg states:
... housing prices should have basically gone flat as of Q4 2002, and instead they have grown at an unprecedented pace. While there is some room for debate on this issue, I put the starting date of the downturn in ‘per worker income’ at Q4 2002. On this basis, we can guesstimate that property in California is now overvalued by something close to 35 or 40%.(emphasis added)Thornberg concludes:
The market is still red hot of course. Price appreciation and market activity continue at a record pace. Nevertheless, right now the bubble is clearly starting to lose steam.
...
The best indicator that the party is starting to end will be a decline in overall market activity—slowing of total unit sales and build up of inventories. When inventories rise and sales start to fall this will spill over into price appreciation and construction within three to six quarters, and this is when the overall economy will begin to feel the pinch. Right now the market appears to be at a crossroads. According to the latest numbers available, market inventories in the state have almost doubled over the past six months and overall market activity has been flat albeit at a very high pace.
...
... things are clearly at a tipping point. And remember, while it is unlikely that nominal home prices will fall rapidly, that does not mean a cooling market will do little damage to the economy. A cooling market is characterized by a large drop in new building units, market activity, and refinancing activity, not to mention heightened foreclosure activity. A lot of the new jobs in those areas will suddenly start to disappear. And don’t forget those wealth effects. When consumers realize they can no longer expect that appreciation bonus to subsidize their consumption habits, they will very likely pull back on spending. Keep an eye out.
Krugman on Bernanke
by Calculated Risk on 10/28/2005 01:27:00 AM
Dr. Thoma excerpts from Dr. Krugman's most recent column: New Fed Chairman Bernanke and the Bubble
Krugman on Bernanke's recent comments: "...soothing words are expected from a Fed chairman. He must know that he may be wrong."
Excerpt (italics Krugman, other Dr. Thoma):
... my main concern is that the economy may well face a day of reckoning soon after Mr. Bernanke takes office. And ... coping with that day of reckoning without some nasty shocks may be beyond anyone's talents. The fact is that the U.S. economy's growth over the past few years has depended on two unsustainable trends: a huge surge in house prices and a vast inflow of funds from Asia. Sooner or later, both trends will end, possibly abruptly.
But hasn't Bernanke said there is no housing bubble, and that the global savings glut explains the international trade imbalance and the dangers there aren't as large as many believe?
...Well, soothing words are expected from a Fed chairman. He must know that he may be wrong.
If he is wrong, what should he do? Does he have what it takes to handle such events?
If he is, the U.S. economy will find itself in need of the "Rooseveltian resolve" Mr. Bernanke advocated for Japan. We can safely predict that Mr. Bernanke will show that resolve. ...
It's reassuring to hear such praise for Bernanke. It sounds like monetary policy is in good hands.
But that may not be enough. When all is said and done, the Fed controls only one thing: the short-term interest rate. And it will be a long time before we have competent, public-spirited people controlling taxes, spending and other instruments of economic policy."
That's not quite as reassuring.
Thursday, October 27, 2005
MBA: Increased use of 'creative' mortgages
by Calculated Risk on 10/27/2005 04:57:00 PM
IBD reports: Data confirm increased use of 'creative' mortgages
Faced with rising interest rates, more U.S. home buyers sought savings by opting for riskier nontraditional mortgages in the early part of this year compared with late last year, more evidence of a trend that has caught the attention of regulators and the mortgage industry at large, Mortgage Bankers Association data released Tuesday showed.Here is the MBA release: Mortgage Originations Rise in First Half of 2005; Demand for Interest Only, Option ARM and Alt-A Products Increases
...
Mortgage activity overall expanded in the early part of this year: the dollar volume of first-mortgage originations on single-family homes increased 10%, while volume for second mortgages rose 12%, the trade group said as part of its annual conference, held in Orlando, Fla.
...
"With the difference in ARM rates and fixed rates narrowing, consumers have shifted from traditional ARMs to nontraditional products," said Doug Duncan, MBA's chief economist.
...
The increase in nontraditional lending prompted the Federal Reserve earlier this year to urge greater vigilance on the part of mortgage lenders too.
The Fed's attention highlighted the growing risk in this area, although some of that risk is countered by the large amount, more than half, of loans locked in at fixed interest rates.
The most popular of the "creative" financing now being undertaken by some households include interest-only loans and option ARMs, a relatively new product that allows borrowers to choose each month to pay interest only, interest plus some principal, or even less than the interest due, with the remaining portion of the interest payment tacked on to the principal.
A Wells Fargo survey released this week showed most holders of these loans were paying toward principal. But some experts said the real test will come in just over a year, when higher interest rates kick in for these loans. See related story.
Interest-only loans increased to a 23% share in the first part of this year from a 17% share late last year, the MBA poll showed.
Option ARM originations rose to 7% of the dollar value of originations and 4% of the loan count during the first half of 2005.
"These percentages are likely understated as many survey respondents did not report their option ARM volume," the group said.
Originations of loans to consumers with riskier credit ratings also increased, the survey found. The share of originations that were so-called Alt-A loans, or those that fall somewhere on the risk spectrum between prime and subprime, increased to 11% from 8%.
The survey also found that the majority of loans, 88% in the first half, were for owner-occupied homes. But a rising share was taken up by loans for non-owner-occupied properties, at a "significant" 12%, MBA said.
Some market observers have said that mortgage risk overall has risen in step with an increase of mortgages on investment property. Traditionally, homeowners are viewed as more likely to keep up with payments on their own residence, less so on the roof not over their head.
*More than 9 of 10 interest only loans originated during the first half of 2005 are adjustable rate products, the remaining loans were fixed rate products.
*Among all survey respondents, option ARM originations were 7 percent of dollar originations and 4 percent of the loan count during the first half of 2005. These percentages are likely understated as many survey respondents did not report their option ARM volume. Among survey respondents that did report option ARM data, option ARM loans comprised 16 percent of their dollar originations and 10 percent of their loan count.
*The vast majority of loans (88 percent) in the first half were for owner occupied homes, but the percentage of loans for non-owner occupied properties was significant (12 percent). This finding is consistent with the 2004 Home Mortgage Disclosure Act data which revealed that more than 11 percent of 2004 originations were for non-owner occupied properties.
*While nearly half (48 percent) of all loans originated were agency eligible, they represented only 38 percent of the origination dollar volume. Agency eligible loans are mortgage loans which conform to the size and credit quality guidelines and would be available for sale to Fannie Mae and Freddie Mac under any of their loan programs.
*From the second half of 2004 to the first half of 2005, reverse mortgage originations increased 28 percent, with FHA’s Home Equity Conversion Mortgages (HECMs) increasing by 31 percent and other reverse mortgages up 8 percent.
*Compared with the last half of 2004, the first half of 2005 origination volume of all second mortgages increased 12 percent, closed-end seconds increased 37 percent and open-end seconds or home equity lines of credit (HELOCs) increased 20 percent (based on companies submitting data for both time periods).
*In the first half of 2005, 82 percent of second mortgage originations were HELOC loans compared with 18 percent for closed-end loans. HELOC origination volume refers to the size of the line, not the drawn amount.
September New Home Sales: 1.222 Million
by Calculated Risk on 10/27/2005 09:58:00 AM
According to the Census Bureau report, New Home Sales in September were at a seasonally adjusted annual rate of 1.222 million vs. market expectations of 1.25 million. August sales were revised down to 1.197 million from 1.237 million.
Click on Graph for larger image.
NOTE: The graph starts at 700 thousand units per month to better show monthly variation.
Sales of new one-family houses in September 2005 were at a seasonally adjusted annual rate of 1,222,000, according to estimates released jointly today by the U.S. Census Bureau and the Department of Housing and Urban Development.
The Not Seasonally Adjusted monthly rate was 97,000 New Homes sold, down from a revised 103,000 in August.
On a year over year basis, September 2005 sales are still higher than September 2004.
The median sales price continued to fall.
The median sales price of new houses sold in September 2005 was $215,700; the average sales price was $285,700.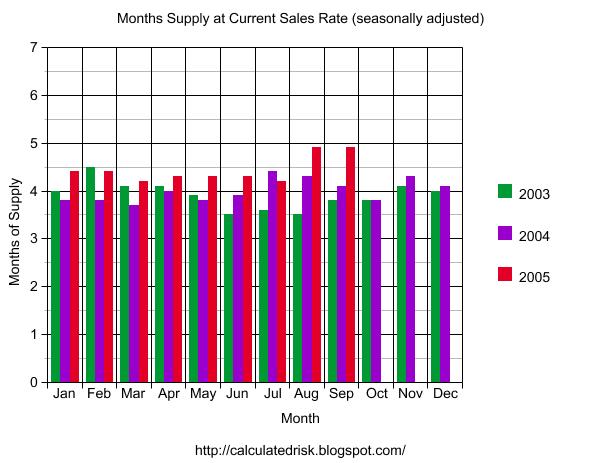
The seasonally adjusted estimate of new houses for sale at the end of September was 493,000. This represents a supply of 4.9 months at the current sales rate.
The 493,000 units of inventory is the all time record for new houses for sale. On a months of supply basis, this is the highest inventory since December 1996 - the end of the previous housing slowdown.
The downturn observed in August has continued into September. This report shows a significant downturn in the New Home Sales market. Sales were off. Inventories were up. Revisions were negative.
It appears the housing market is slowing.


