 RSS Feed
 by Calculated Risk on 7/25/2005 05:49:00 PM
Monday, July 25, 2005
Contract Oil Prices
Back in April, on Angry Bear, I suggested that a sustained oil contract price above $50 per barrel might lead to a recession.
UPDATE: By "contract" I mean actual price paid for oil, not Futures contract. The DOE provides the average price paid per contract on a weekly basis. When measuring the impact on the economy, I want to look at the actual dollars paid. Sorry for any confusion.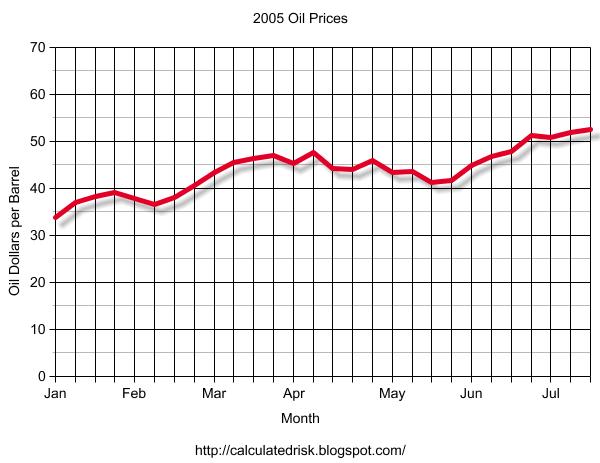
Click on graph for larger image.
The average contract price for a barrel of oil has been above $50 for four consecutive weeks.
The DOE expects this trend to continue and they are projecting spot prices to "average $59 per barrel for the third quarter of 2005" and "above $55 per barrel for the rest of 2005 and 2006".
NOTE: Actual contract prices are usually $5 to $10 per barrel below spot prices.
Based on my earlier calculations, I believe the price of oil is now in the danger zone for the economy. The good news is the price is being driven by growing demand as opposed to a supply shock like in '73 and '79. We will probably see some slackening of demand in the near future and that should lead to somewhat lower prices.
EDIT: Greenspan believes the current price of oil will not hurt the economy:
Should the prices of crude oil and natural gas flatten out after their recent run-up--the forecast currently embedded in futures markets--the prospects for aggregate demand appear favorable.However he cautioned:
Energy prices represent a second major uncertainty in the economic outlook. A further rise could cut materially into private spending and thus damp the rate of economic expansion.
Sunday, July 24, 2005
Premature Celebration
by Calculated Risk on 7/24/2005 10:13:00 PM
On Angry Bear I discuss a tale of two governors and the danger of premature fiscal celebrating. We should also consider the recent premature celebration by the Bush Administration.
Click on graph for larger image.
This graph shows the Year to Date (July 21st) and full fiscal year increase in the National Debt for 2001 through 2005.
The graph shows that for YTD fiscal 2005 (Oct 1, 2004 - July 21, 2005), the National Debt has increased $489.6 Billion. This is almost the same as for the equivalent period for the previous two years. Last year for the same period was $494.5 Billion.
Not exactly cause for celebration.
I will stick to my earlier prediction that the National Debt will increase more in Fiscal 2005 than in Fiscal 2004. It will probably be close, but this is far from the claims of the Bush Administration. Of course the Bush Administration isn't talking about reductions in the increase in the debt, they are discussing improvements in "forecasts" for the Enron style "Unified Budget".
Housing: "Rapid shifts putting chill on hot June data"
by Calculated Risk on 7/24/2005 04:06:00 PM
Rising inventories is the story in many housing bubble areas. The Sacramento Bee reports:
While the latest sales statistics for June show more of the same - a strong market with rising prices - many agents and brokers say the lagging data don't reflect recent market trends. The number of homes for sale has risen to levels not seen since the late 1990s, they say, and buyer psychology is changing fast.I think the surge in inventories will show up in June's Existing Home Sales numbers (released this coming week), but we may have to wait until the July numbers are released.
"We are in a shifting situation right now," said broker Pam Petterle, the manager for Prudential California Realty's Sacramento-Tahoe region. "The biggest change is that we have a much greater inventory ... and that's a major change because it shifts the balance from sellers driving this market to a more balanced market. There are not as many multiple offers, and listings are staying on the market longer."
At the end of June, the inventory of resale homes on the market in Sacramento, Placer, El Dorado and Yolo counties rose to 6,246. It was the highest for any June since 1999 and the most for any month since September 2001, according to TrendGraphix, a local data firm affiliated with Lyon Real Estate.
Saturday, July 23, 2005
Housing, Jobs and Bernanke Revisited
by Calculated Risk on 7/23/2005 02:02:00 AM
The Press-Enterprise quotes UCLA economist Christopher Thornberg on California's Inland Empire:
Thornberg also agreed ... that construction is the Inland area's economic driver -- a situation he finds troubling for the area.In a previous post I suggested CEA Chairman Bernanke misspoke when he argued that jobs were a driving factor in higher home prices. Dr. Hamilton of Econobrowser came to Bernanke's defense showing that there was some correlation between jobs and higher home prices (on a per state basis over the last 5 years). However, I believe Dr. Hamilton confused correlation with causation.
"There's a housing bubble and it's going to burst," he said. "When it does, everything else is going to start falling like dominoes behind it."
NOTE ADDED: I really enjoy Dr. Hamilton's blog and recommend it highly. I just disagree with him on this point.
I've argued for some time that the housing bubble was leading to RE related job creation (not the inverse). Apparently Dr. Thornberg agrees with me. In fact, if you back out RE related jobs, the correlation between jobs and housing prices appears to disappear.
I only analyzed a few states since this is a big job and the state by state BLS data varies. I looked at the boom states of California and Nevada, and bust states Ohio and Tennessee. In California, 309K of the 361K jobs added since March 2000 were RE related. In Nevada, it is 83K out of 189K. The reverse is true for Ohio and Tennessee; both of these states have lost RE related jobs. Although this isn't definitive, I would argue that the causation is the housing bubble is creating jobs - not jobs leading to higher housing prices.
To echo Dr. Thornberg: There is a housing bubble, it is going to burst, and those areas dependent on housing related jobs will experience a snowball economic effect.
Friday, July 22, 2005
Housing: Storm Clouds?
by Calculated Risk on 7/22/2005 01:35:00 PM
Next week, the National Association of Realtors will report June Existing Home Sales. Also, the Census Bureau will report New Home Sales. I expect the sales numbers to be strong, but I will be looking closely at inventories. There have been numerous local area reports of rising existing home inventories for June, and this report should tell us if rising inventories is a widespread phenomenon.
Click on graph for larger image.
Inventories have been relatively flat for the last year with normal seasonal fluctuations.
A jump in inventories to 2.7+ million would probably be a warning sign for the housing market.
On another note, General Glut predicts "The end of ultra-easy mortgage money". Gen'l Glut writes: "These interest rate hikes should hit ARM-dependent markets in particular -- and that means California." I concur.
The Mortgage Bankers Association reports:
The adjustable-rate mortgage (ARM) share of activity increased to 28.5 percent of total applications from 27.9 percent the previous week.Given the spread between the various mortgage products, I'm surprised anyone is using an ARM. The breakeven point for a 30 year fixed rate mortgage vs. a 1 year ARM is less than 3 years. For those using a 5/1 year ARM (fixed for 5 years), the rate is the same as a 15 year fixed!
Since 28% of all application are for ARMs, this probably means:
1) Buyers think interest rates will decline in the future, or
2) Buyers are planning on moving within 3 years, or
3) Buyers can only qualify with a reduced payment.
None of these reasons seem compelling. I think this is more evidence of speculation / excessive leverage.
UPDATE: Rising "Workouts" (Thanks to Ben Jones)
Typically, mortgage delinquencies and foreclosures result from an unexpected financial crisis - a job loss or medical illness that leaves homeowners unable to pay the bills. But now experts are warning that homeowners who - thanks to low rates - have taken on more debt than they should have, face a growing risk of mortgage delinquencies and foreclosures.
Indeed, the first signs of it are starting to emerge. The number of homeowners seeking loan workouts reached 89,741 in the first quarter of 2005, compared with 155,495 for all of 2004, according to the U.S. Department of Housing and Urban Development.
Last month, Standard & Poor's Ratings Services in New York said the risk of defaults is growing on certain adjustable-rate mortgages. These loans initially can lower monthly mortgage payments, allowing some buyers to purchase homes they otherwise couldn't afford. Some borrowers may face increases in their monthly payments of 50% to 90% when the low-rate period ends, S&P warned, and homeowners who haven't planned carefully, or whose income proves insufficient, may default.
"With some of the very unique and potentially risky loan products out there now, and the very high rate at which they're being used, it could turn into the full employment act for loan workout specialists," says Laurie Maggiano, deputy director of the office of single family asset management at HUD.


